Here is The Largest Reason for Community Bank Consolidation
Community banks (under $10B in assets) serve a key role for borrowers, local communities, and the broader US economy. Community banks are better positioned than many other creditors to follow and adapt to local economies, industries and trends, thereby, being better stewards of capital. Community banks may also serve as buffers for the extreme swings of business cycles not to mention also financing small businesses, some of which succeed to become world-leading enterprises. In recent years, the community banks’ market share has been diminishing markedly as bank consolidation has occurred. However, we believe that this trend is reversible. We outline the one tool that only a few community banks are using, but that one tool we believe is responsible for keeping community banks (and non-community banks) profitable, independent and long-term viable.
The U.S. Commercial Banking Model
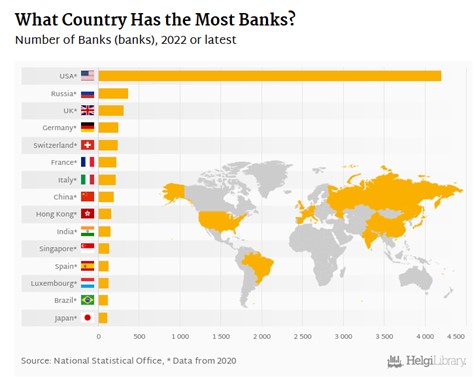
The U.S. is unique in the considerable number of banks serving the needs of consumers and businesses. The graph below compares the number of banks and savings institutions per country demonstrating that the U.S. is home to many more banks than any other country in the world. We believe that this substantial number of regulated creditors has led to a more vibrant business climate, more access to capital, and higher economic competitiveness. More banks in more communities can sustain better liquidity for borrowers, financing of new and novel business ventures, and generate greater financial ingenuity and banking product development.

Community Bank Consolidation
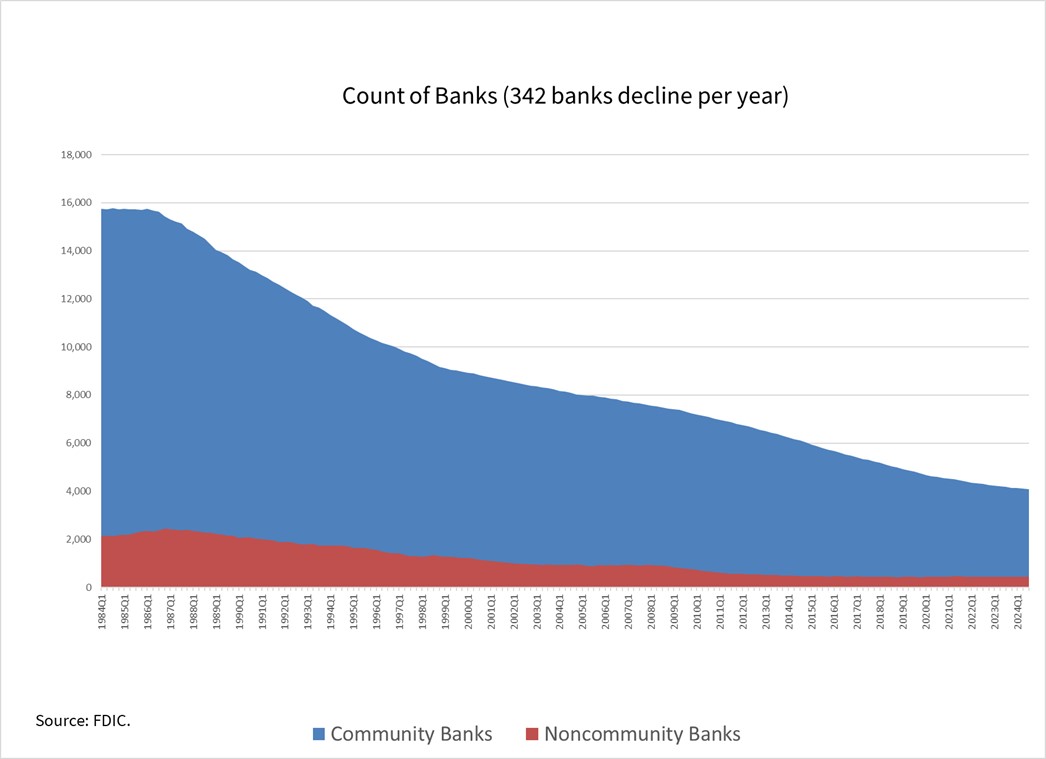
As of Q3/24 there were approximately 4.5k FDIC-reporting institutions to include banks and savings institutions. The number of U.S. banking institutions has been declining steadily from almost 16k banks in 1984, at a steady rate of about 350 institutions per year. And very few new banks are being formed to replace the rapid industry consolidation. What is noteworthy is that in the last 13 years, community banks represent virtually all the decline in the number of charters as shown in the graph below.

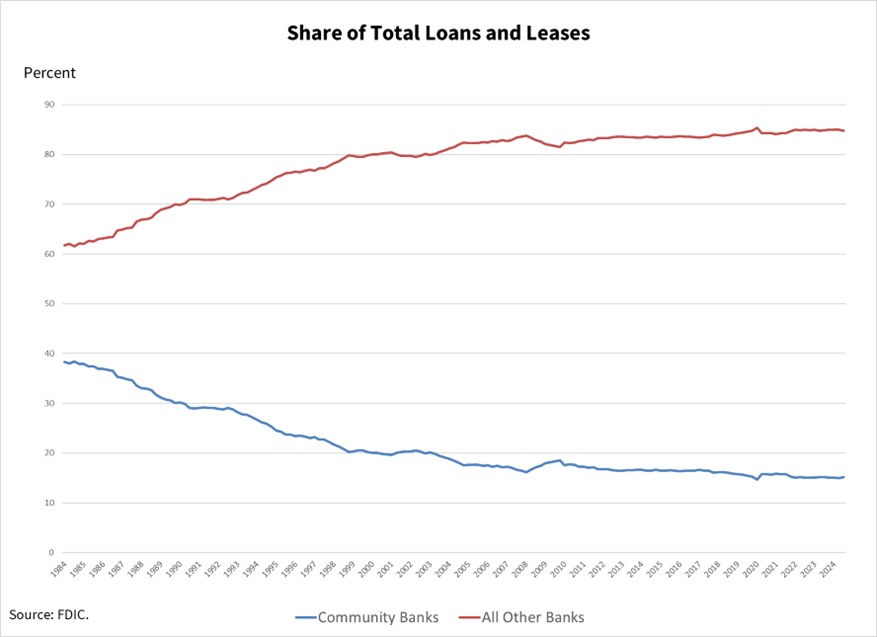
While in Q3/24 there were only 435 banks over $10B in assets, those 435 banks hold 85% of all loans and leases. The share of the loan market held by community banks has declined more rapidly (proportionately) than the number of charters. Not only are there fewer community banks, but their market share is shrinking and becoming a less sizable portion of the overall banking market. This is an important development for a few reasons, but most importantly, because community bank competition is more likely to be non-community banks. That means that community banks must be able to offer products, services, and channels that are offered by non-community banks, and community banks must be able to measure instrument-level performance like non-community banks (more on this below).

Measure of Bank Performance
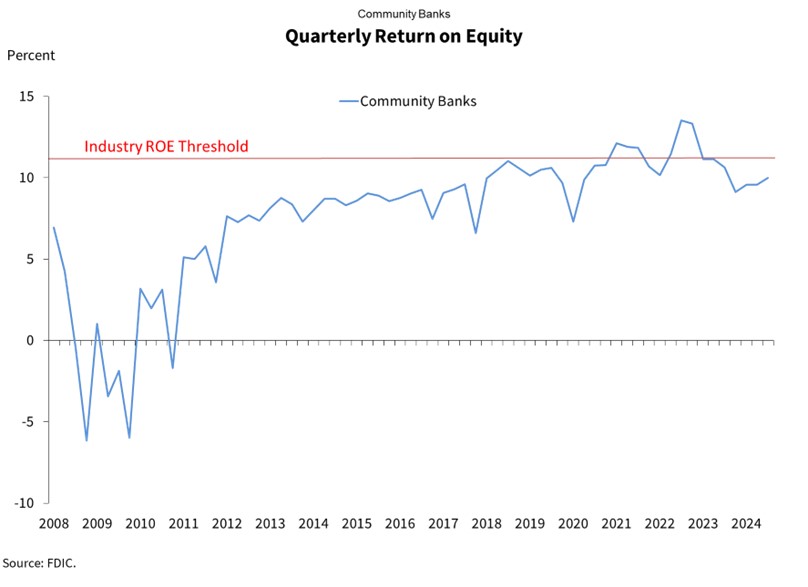
Shareholders, analysts, and managers almost universally measure a bank performance over the long run using return on assets (ROA) or return on equity (ROE). Banks that cannot consistently generate sufficient return to shareholders (given the risk or variability of a bank’s return) are subject to pressure to sell. Historically, on average, community banks have been unable to generate the required ROE for shareholders (we calculate that threshold at approximately 11.0 to 12.5% depending on the period). Below is the quarterly ROE graph for community banks. However, top performing community banks have generated more than the minimum ROE threshold – conversely, the bottom performing community banks have been acquired or have failed.

The Problem with Ex Ante Inputs
Ex ante is the measure on a forecasted basis. We feel that the community bank industry consolidation is not explained by scale, regulation, or access to technology or employees. Instead, we believe that community banks are not measuring the correct ex ante variables for products and services that they offer.
We estimate that about 90% of community banks measure ex ante performance using margin only. It is true that in total, the higher the net interest margin (NIM) (all else equal), the higher the ROA/ROE. But at the instrument level for commercial loans, all else is not equal. For community banks (and all banks) the relationship between NIM and ROA/ROE is non-existent. Commercial products are heterogenous instruments and pricing to maximize yield (or increase the bank’s NIM) does not help drive ROA/ROE.
While many bank managers focus their lenders on increasing loan yield, the result is (expected) lower ROE for the bank. We estimate that only about 10% of community banks use a risk-adjusted return-on-capital (RAROC) loan pricing model. Therefore, for banks that do not use RAROC to determine pricing and make loan decisions the only variable that is easy to measure ex ante is margin, and this leads banks astray. On the other hand, virtually all regional and national banks use some version of RAROC loan pricing, and those banks make pricing decisions using ROA/ROE as ex ante measurements.
Objectives of RAROC Loan Pricing
National and regional banks originate about 85% of all loans, and community banks hold the remainder. Why do banks use RAROC loan pricing models? The most common reasons are as follows:
- Increase granularity of credit pricing,
- Accurately allocate capital,
- Maintain lender discipline to minimize cover bid,
- Educate management and lenders,
- Become more attuned to prevailing market conditions,
- Standardize pricing across divisions, product lines, and relationships,
- Increase profitability,
- Decrease risk,
- Manage customer relationships, and
- Enhance reporting, control, and governance.
Community banks that do not use RAROC pricing models will, eventually, may underprice low ROA/ROE loans (being undercompensated for capital deployed) and lose to the competition overpriced loans (to the banks that use RAROC tools).
Conclusion
To survive and thrive, we believe that community banks must embrace RAROC models and apply pricing discipline to individual products, relationships, branches, employees, lines of business, and geographies. Non-community banks have largely adopted RAROC tools to price products and services. Community banks can develop their own tools or purchase third-party RAROC tools to price relationships to help them properly allocate capital. SouthState is a big proponent of RAROC tools and offers such tools to other community banks as shown here.

