The Macrodata Refinement of Scary ALM Numbers
As fans of the hit Apple TV psychological thriller Severance know, one of the jobs of severed Lumon employees is to find the numbers that elicit negative emotions and make them disappear. Similarly, bankers must do the same thing when dealing with asset-liability management (ALM). This article examines how running multiple bank simulations can help bankers uncover those scary numbers and mitigate their future risk.

The Probabilistic Future of Banking
As bankers, we have no idea where the economy, credit, or interest rates will go over the next several years. However, that doesn’t stop us from basing our banking strategy on the most common market opinion at any given time. For example, we think rates will decrease in the next six months, so we plan our budgets and allocate capital accordingly.
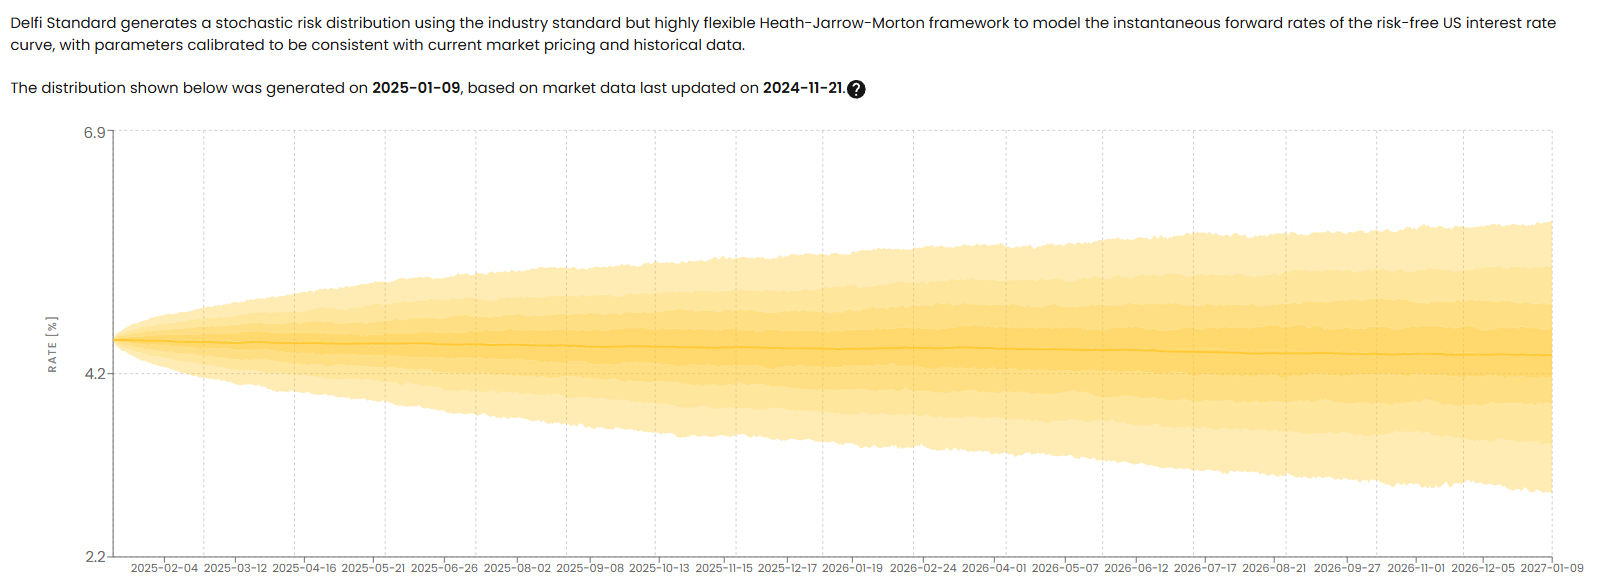
There are five main problems with this approach. One is that we set a strategy on a single future path instead of taking into account the realm of possibilities. The graph below represents the current potential path of composite SOFR out to 2027. As can be seen, SOFR is almost as likely to move up as it is down over time.
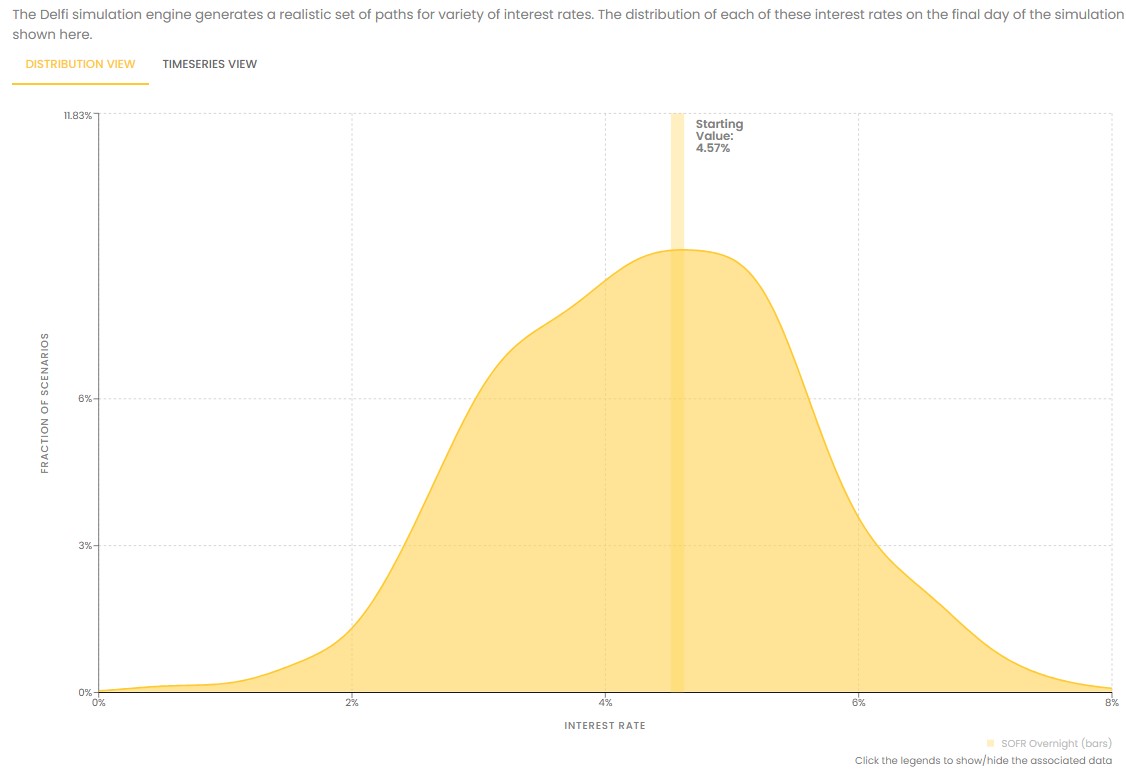
To get a better feel for what this means, below is the same data in a distribution form, instead of a time series. While this is a normal distribution it is not exactly symmetrical. There is a higher probability that SOFR hits 6% than it hits 2%. A bank that plans its strategy around a single rate view is ignoring a material part of potential negative rate movement.
The second problem is that bankers usually take the opinion of a single source, such as the Fed’s Dot Plot, the market’s forward curve, a CNBC commentator, or our favorite local economist. This opinion may or may not be accurate. In fact, from a probability standpoint, that single view is likely wrong.
The third issue is that most commonly held economic views are only one year in nature, where a bank needs to make decisions based on much longer-term instruments such as a five-year fixed-rate loan. The fourth problem is a huge one. Bankers often price loans and deposits on where rates are today on a single point on the yield curve completely ignoring the shape that yield curve and the future of rates. This is like filling your car up with just enough gas for the next trip but then expecting the cost of future trips to be exactly the same for the next five years ignoring the fact that both gas prices could change AND the mileage of your trips might change.
Finally, few bankers identify the specific factors that need to change before their view or strategy changes. As such, banks tend to be slow to pivot their strategy.
The reality is that banking decisions need to be based on probabilities of occurrence. We now live in a world where running thousands of scenarios on the economy and interest rates is relatively easy. These thousands of scenarios can not only better inform our decisions but also allow us to change strategy quicker when conditions change.
Four Lessons From An ALM Case Study
For discussion, we will utilize tools from Delfi that allow bankers to run realistic interest rate and credit scenarios of all balance sheet items and simulate multiple “what-if” scenarios. We will use a typical $3B asset-sized bank that is composed of 91% loans and has $2.2B in non-maturity deposits with a current beta of 51% and a cost of funds of 2.95%. The bank has an average loan yield of 6.77%. After credit, origination, and management costs, that loan has a spread of 5%. If you adjust for the 2.95% cost of funds, the bank is left with a 2.05% spread. While not great, it is even worse as 2.05% must absorb credit volatility AND interest rate plus liquidity risk.
Lesson One: Know the Cost of Credit and Deposits
To get rid of scary ALM numbers, the first step is to understand what numbers bring anxiety. You don’t have to medically separate your work life as in Severance to achieve this. Still, you do have to use a funds transfer pricing concept like what we use in Loan Command to allocate profitability between loans and deposits.
Most banks have little feel for where their funding curve lies and, as such, have a difficult time distinguishing when a loan is unprofitable versus a deposit. Generally, banks that don’t establish their funding curve use the SOFR index on the short side, and the swaps curve out longer. Alternatively, other banks use the Treasury curve and then add a credit component. Regardless of the index used, the important part is that that the bankers have a reference point to know where value is derived.
Lesson Two: Your Assumptions May Not Be Reality
As previously mentioned, bankers often have a rate view that is equal to the market’s at a particular point in time. While a bank may run an ALM scenario of that one rate view, that is just a single path. The better approach is to run multiple paths. Using a tool like DelFi’s Overwatch, we can run thousands of realistic interest rate paths and look at the distribution of the balance sheet performance potential.
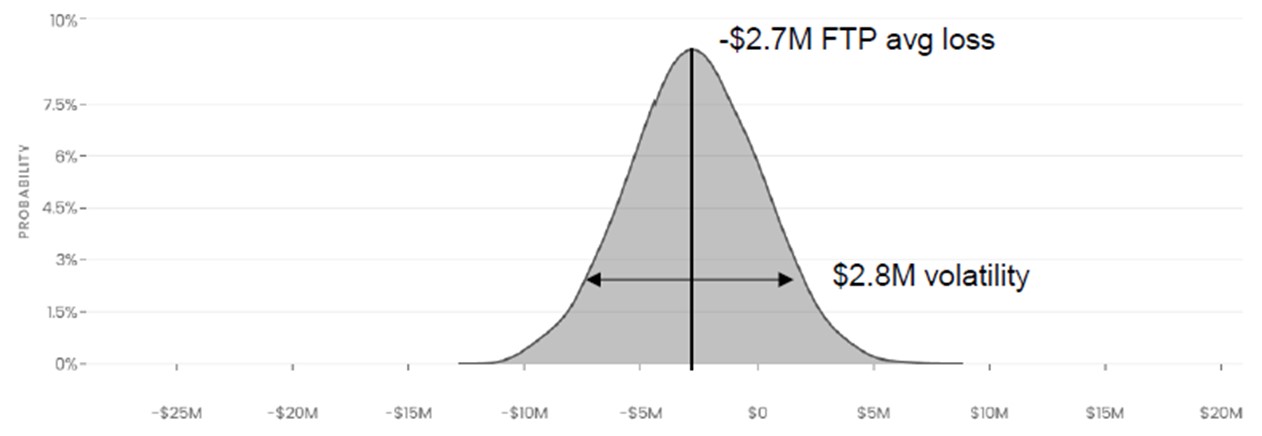
In this case (above), despite including the potential for further rate cuts, this bank is still expected to lose $2.7 million on its deposits due to overpricing and structuring. This projection has a $2.8 million volatility, so the $2.7 million expected loss could be $1.4 million worse or better as a probabilistic worst and best case, respectively.
To recap what is happening here, the bank has a single rate view with an unspecified horizon and consciously or unconsciously based a strategy around this view. While the banker believes their base case will result in a zero ALM loss, the reality is that, in all likelihood, the bank will take a loss on their deposits because of mispricing.
Now, we are just picking on deposit pricing and structuring, but we could also do the same analysis for this bank’s fixed-rate loans, which results in an even greater potential loss.
Lesson Three: Take Action Before Its Needed
By simulating multiple paths, a bank can better understand its weak points as if it is peering into the future. Conversely, you can also understand what has to happen in the market or banking environment where capital becomes impaired to the point of needing to raise more equity, similar to what happened to First Republic or Silicon Valley Bank.
In our case study, this bank clearly has a weakness with non-maturity deposit pricing. While the problem may solve itself if rates drop enough, chances are it won’t. It would be better to reprice deposits now and mitigate the risk of a variety of market scenarios. This is a major tenant in risk management – when a problem is identified, you solve the risk immediately and do not further speculate on a potential solution. In our case study, if the bank waits for lower rates and the Fed pauses now, their deposit loss increases.
Lesson Four: Understand Your Options
Solving ALM balance sheet problems in banking is a trade-off between profitability and risk. In our case study, we know we need to reprice deposits, and thus, we can simulate the potential impact of changing prices and see what that does to deposit runoff. We use the Delfi Prophecy module to run the deposit simulation. For this particular case, we target a beta as a measure of deposit rate sensitivity and then back into what the pricing has to be and see what deposit runoff occurs. We get the options below:
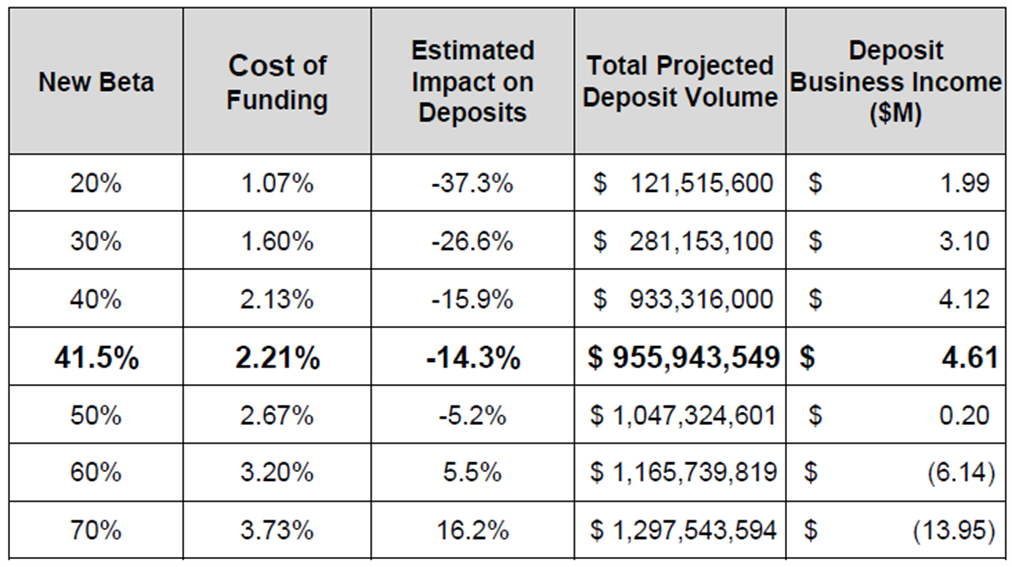
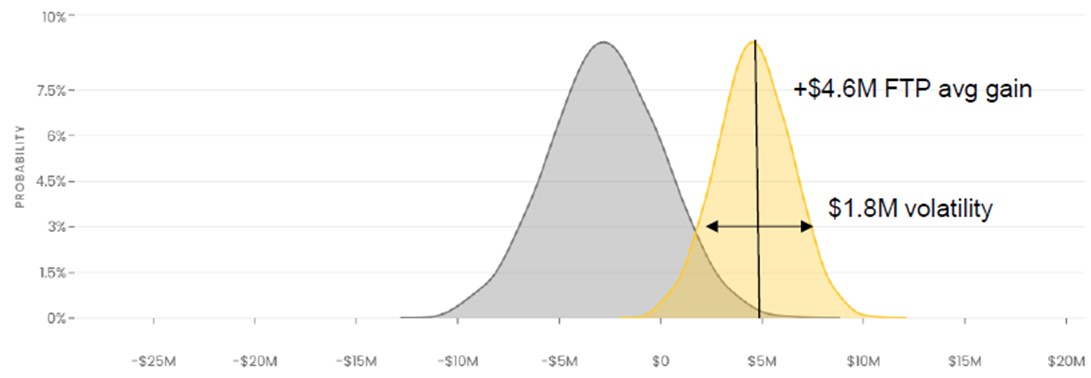
After looking at a variety of deposit betas, the model optimizes on reducing beta to 41.5%, which reduces the overall cost of funding to 2.21% (from 2.95%) as it produces $4.61 million of value over the next 12 months. Of course, the bank must let 13% of their more rate-sensitive depositors run off, so it needs to shrink by approximately $300 million. This is a good example of how often the right strategy for a bank is to shrink, which is counterintuitive to many bankers.
We can rerun the scenario set and see the bank picks up 28 basis points on deposits compared to their funds transferred price cost. Profitability shifts to the right and this now turns that projected $2.7 million loss on deposits to a $4.6 million gain. In addition, because the deposits become more predictable, volatility is reduced from $2.8 million to $1.8 million.
Allocators of Capital
When it comes to ALM, one of the main decisions bankers need to make is how to allocate capital across various durations, products, geographies, customers, and credit sectors. Having a simulation tool at their fingertips allows banks to rapidly model balance sheet strategies and eliminate those numbers that can cause anxiety. In our case study, the first-order result is to lower deposit pricing and let a certain amount of deposit balances runoff. This is a potential optimized state.
Bankers can also use these tools to consider how they can more profitably replace that $300 million of lost deposits. Here, we can see the impact of brokered deposits or what happens if we spend $1 million on marketing for treasury management services to gather those deposits back.
As data and artificial intelligence become more commonplace in banking, bankers will have more of these tools at their disposal. At Lumon, the mysterious corporation that is at the center of Severance, if you do a good job finding the scary numbers, you get a coveted Egg Bar for your staff. While bankers may not achieve that level of food glory, by using these tools to look ahead, bankers can do a better job at optimizing their balance sheet to allow for greater profitability and less risk.

