4 Insights on 2025 Banking Performance to Improve 2026

With most of the banks filing their call reports, there are some interesting pictures of the banking industry that emerge. We use Amberoon’s Statum platform to analyze community banks under $20B in total assets to highlight four trends from 2025 banking performance that merit addressing when it comes to enhancing profitability in 2026.
Loan and Deposit Growth
When it comes to 2025 banking performance, growth and profitability go hand and hand. Loan growth came in at around 6.3% and deposit growth came in at 6.1% for 2025, against a backdrop of approximately 4.2% GDP growth in 2025. Loans showed steady growth throughout the year while deposits grew mostly during the front half of the year and then moderated.
Growth was best in the $1B to $5B total asset range for banks.
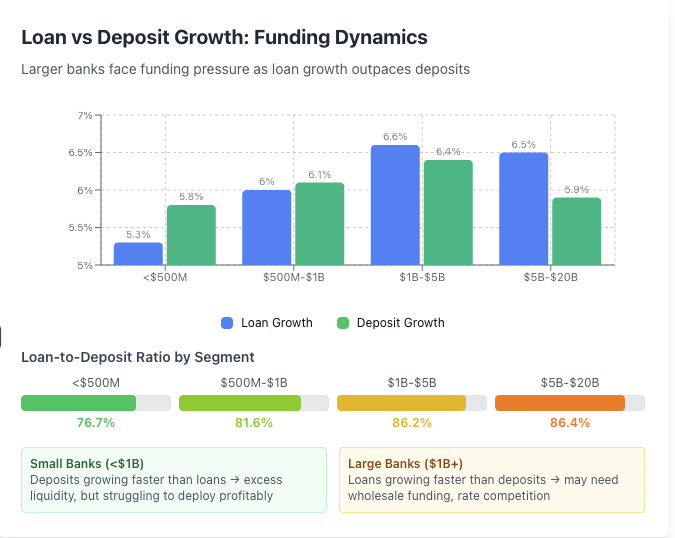
The challenge arises that for 2026, loan growth is projected to come in at 6% again, but the slowing trend in deposits, despite lower rates, mean more bank apathy, less rotational movement, and a tougher sales / marketing picture for banks. Growth, given the current trends, is expected to come in at 5% for 2026.
The fact that community banks also grew at just faster than GDP also presents a challenge as community banks will have a harder time competing with the national banks due to increasing volatility and uncertainty in the market. 2025 was uncertain enough, but 2026 is expected to be worse with greater geopolitical risk, potential rising inflation, and volatility around mid-term elections.
Faster loan growth than deposits also means more pressure on bank loan-to-deposit ratios which means more pressure on cost of funds.
The takeaway here is that 2026 is a year to increase more allocation to deposit building and management vs. loans to counteract the natural growth trends. Banks also need to figure out ways to better compete against fintechs, national banks and credit unions to increase growth at a faster pace relative to GDP which is expected to continue to slow.
We Can Do Better Managing Deposits
Cost of funds fell approximately 24 basis points for community banks despite three, 25 bps rate cuts in 2025 coming at the back half of the year. Due to high loan-to-deposits, lack of differentiated product, strong deposit competition and too great an adjustment lag, community banks were unable to reset their cost of funds down enough to match or exceed their asset yield.
Going forward, in addition to greater resources targeted at deposit performance and deposit product design, banks should consider being more proactive in moving deposit rates outside of target Fed Funds movement.
As we urged last year, market rates started to decrease in late 2024 and again in July 2025 for a total of 1.24% in short-term rate movement. This made other non-bank alternative investments such as Treasuries and money market mutual funds less attractive. Despite this market yield drop, most banks didn’t reset rates until some two weeks after the Fed started to cut rates in mid-Sept. Even if your bank doesn’t want to be proactive in moving rates along with the market and wants to wait for the Fed to move rates, it must find faster ways to reset exception pricing down.
Further to this point, banks need to be more aggressive in adjusting CD duration and pricing. When the market started to reset down in 2024 banks continued to increase CD duration as opposed to decreasing it.
For 2026, history could be repeating itself. There is some 57 basis points of expected rate decline built into the forward market. Even if you don’t believe it, shortening CD duration by targeting shorter maturities still lets you compete and stem deposit runoff while positioning the bank with a shorter liability structure of rates.
Next to slow CD repricing, banks were also slow to bring down their money market rates despite decreasing interest rate sensitivity. Greater economic fear and lower priced alternatives helped deposit performance at banks that were aggressive in bringing down their MMDA rates.
Further, the mix shift into cheaper and longer duration liabilities also helped funding performance.
2025 Banking Performance – Net Interest Margin
Net interest margin peaked in Q3, dropping 9 basis points in 4Q and finishing the year with an increase of 11 bps. This increase was largely driven by cost of funds resetting down faster than assets for banks on a weighted basis. That said, for 65% of the banks in the cohort, margins contracted as these banks could not drop deposit rates fast enough.
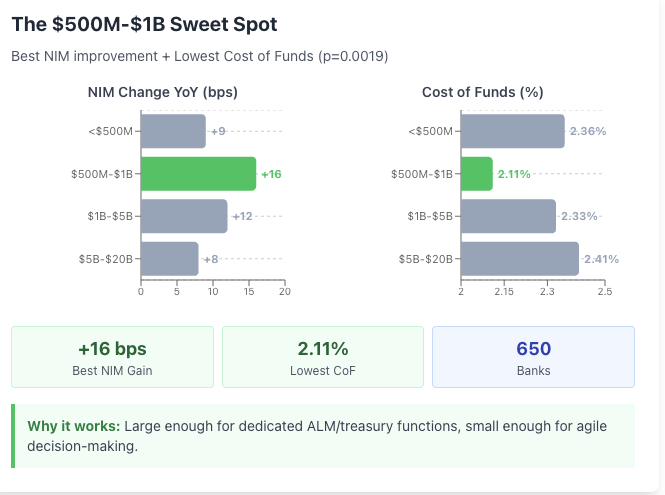
The standout was the $500mm to $1B asset sized banks. This group performed the best of any bank size, increasing margins by 16bps, having the lowest cost of funds in the industry, putting up the best deposit performance, and having slightly more deposit growth than loan growth.
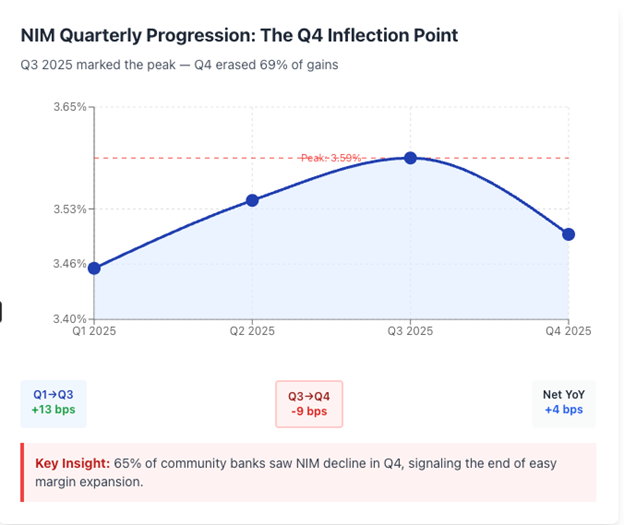
For 1Q 2026, we predict NIM should increase an addition 5bps based on steady short-term rates, but greater CD maturities (many 2024 vintage CDs are rolling off). Deposit competition should also continue to moderate reducing bank’s beta.
Capital, Return and Efficiency
The returns for 2025 banking performance (for banks below $20B) came in at 11.4%, or just slightly above their cost of capital. The majority of banks under $250mm, unfortunately, produced under their cost of capital at 9.8%.
For banks that are under their cost of capital, stronger management of deposits is critical. In addition, many of these banks would benefit from slowing growth as these banks are growing out of existence at a faster rate.
Outside of that, it’s an efficiency story. Banks needed an efficiency ratio below 57% to drive above average performance. The average bank below $20B had an efficiency ratio of approximately 59%. What is hurting banks is a combination of their lending origination costs being too high and/or their branch costs being too high.
Many banks need to right-size their branches, particularly against a backdrop of falling rates. Consolidating branches frees capital to invest in a more efficient core, onboarding, and loan origination system.
Finally, there is an issue with earnings volatility. Returns don’t tell the full story. Bank valuation is partially based on the consistency of returns. Banks in the $1B to $10B tend to have the greatest earnings volatility which explains why the public banks in this cohort trade at the lowest price to tangible book.
Putting This Into Action
While 2025 banking performance was respectable, it was against a backdrop of falling rates, a steepening yield curve, low credit losses, cheap capital, and regulatory optimism. The industry outlook is the best it has been in years and banks need to take advantage of these good times to improve their deposit structure and their technical architecture to be in a position to withstand lower asset yields and potential credit shocks.
When we look ahead for 2026, we see greater volatility rewarding those banks that can adapt, stay nimble, and keep playing offense. Gen AI and agentic AI, combined with the tokenization of value in the form of tokenized deposits and stablecoin provides community banks with a significant advantage if they can take advantage of these trends before their competition.