Drivers of ROA for Community Banks
In Q2/24 the average return on assets (ROA) for community banks (under $10B in assets) was 1.08%, with an average ROE of 10.44%. But within the community banking sector, performance varied among banks significantly. We analyze the drivers of ROA for the community bank segment last quarter and consider what financial variables explain bank performance.
The Data Behind The Drivers of ROA
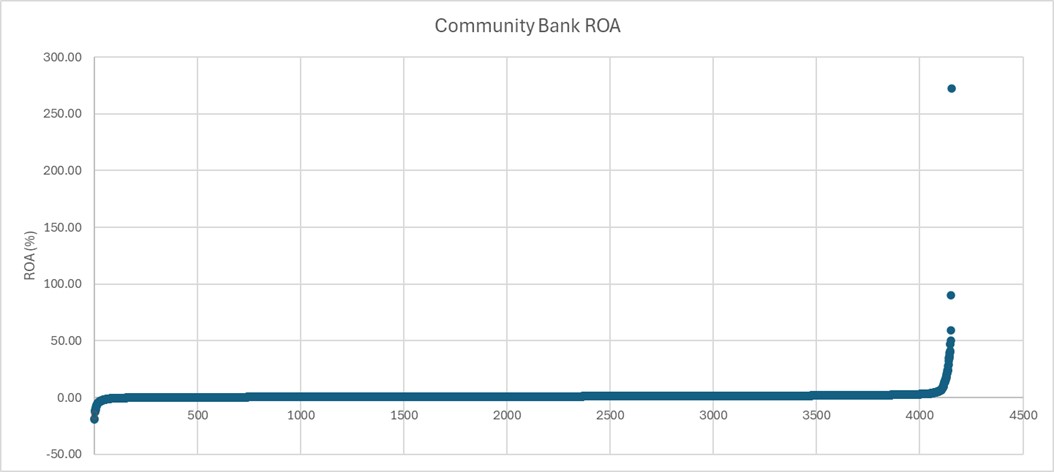
In Q2/24 the number of FDIC-reporting community banks was about 4,100. The ROA for the community bank sector is shown in the graph below. While the average ROA was 1.08%, there were many outliers. Approximately 5.7% of community banks reported negative ROA. Another 16.2% of community banks reported a positive ROA of less than 0.50% – these are troubling numbers during a growing economy when non-performing assets are low by historical comparison.

The bottom 10% of community banks averaged an ROA of negative 0.92%. However, the top 10% of community banks averaged an ROA of 6.62%. There were more outliers on the right side of the graph than on the left side. The ROA standard deviation for community banks was calculated at 5.2%. Such wide dispersion of performance, especially during a benign credit environment, demonstrates that some community banks have successful business models, while other banks may be forced to merge with better performing peers. We believe that this bodes for continued segment consolidation especially in the next credit cycle.
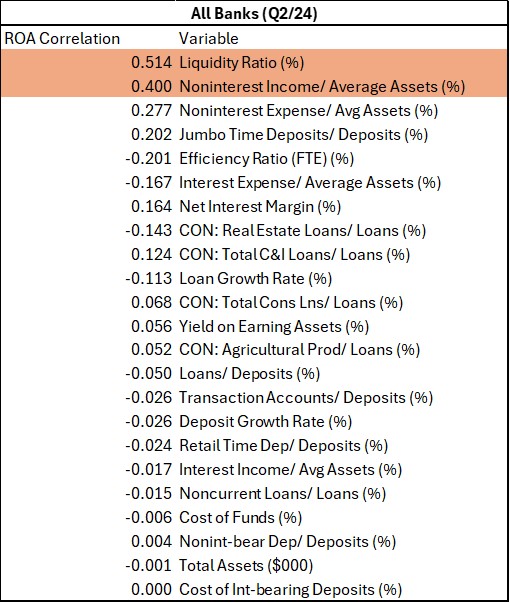
To find the drivers of ROA, we consider 23 different variables, and run a correlation analysis for each variable. For all reporting banks in Q2/24 the two variables that demonstrate a meaningful statistical relationship to ROA are liquidity ratio and noninterest income to average assets. The table below shows our analysis for all reporting banks.

The other variables in this table do not show a meaningful statistical relationship to ROA. Our analysis was done on a single reporting period (Q2/24) and different periods will reflect different industry environments and different correlations. We have also looked at these same variables over 5-year reporting periods – the subject of other articles. In Q2/24, it may appear that a bank’s liquidity ratio was the largest statistical relation to ROA, and this makes sense given growing competition for deposits. Over a business cycle, we have not seen liquidity ratio demonstrate such a pronounced statistical relationship. However, over business cycles and across various bank peer groups, we have noted that noninterest income (fee income) demonstrates a consistent and high relationship with ROA, and this relationship also held true in Q2/24
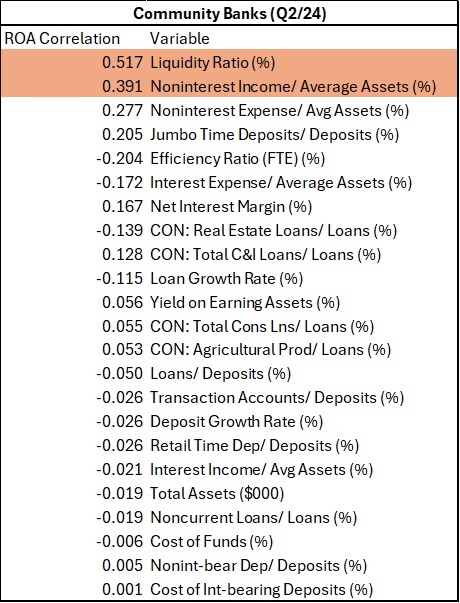
We also measure these same 23 banking variables for community banks for Q2/24. The same two variables demonstrated similar statistical relationship to ROA – liquidity ratio and noninterest income to average assets. The table below shows our analysis for all reporting community banks.

We point out that noninterest expense to average asset has the third highest correlation to ROA (but not statistically significant for Q2/24). It no longer surprises us that this correlation is positive and not negative – meaning, banks that spend more on noninterest expense, produce higher ROA results. We have observed this behavior through business cycles.
Interestingly, when we eliminate the top 10% and bottom 10% of community bank performers, the single biggest jump in correlation is the efficiency ratio (at -0.742). Efficiency is one of the most important drivers of ROA. At this point of the business cycle, especially (late expansion), more efficient community banks demonstrate higher ROA.
Conclusion and Takeaways
In the community banking sector, such wide dispersion in performance, as measured by ROA, is a reflection of the wide variety of strategies employed by community banks. The suprising part here is the underperformance as measured by ROA, in a healthy credit cycle. Underperforming banks have historically been acquisition targets, and consolidation will only accelerate when credit conditions deteriorate. This is despite the fact that many of these underperforming banks have solid and defensible business models plus operate in thriving communities. This underperformance is a result of these banks not having the strategy and the tools to earn above their cost of capital.
Many of these underperforming banks are not aware of the drivers of ROA and lack the tools to be able to measure what drives profitability for each product, branch, and manager – without such tools we have seen some bankers struggle chasing variable that do not lead to enhanced performance as measured by ROA. In the latest reporting period, it appears that community banks with lower efficiency ratios, higher liquidity ratios, and higher noninterest income outperform the industry average.

