
Fee Income Drives Community Bank Performance: Q3 2026 Review

We reviewed 3,853 banks under $10 billion in assets for the third quarter of 2026. The median bank posted a 1.32% ROA and 12.65% ROE. Nearly one in three community banks earned less than a 1% ROA in Q3 2026. The community banks that outperform are not the ones with the widest margins – they are the ones that run efficiently and earn revenue beyond net interest margin.
The typical community bank earned a 4.03% net interest margin, ran a 64% efficiency ratio and generated just 0.43% of average assets in noninterest income (median). That last number is the problem this article addresses. While margins have expanded (for now), this has not been enough to lift a large share of the industry past its performance targets.
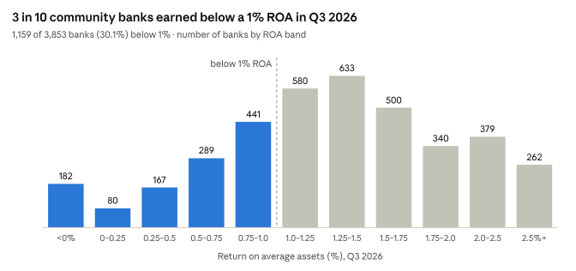
As shown in the graph above, of the 3,853 banks in the data set, 1,159 (30.1%) earned below a 1% ROA, 429 (11.1%) earned below 0.50%, and 182 (4.7%) lost money. On an equity basis, 1,694 banks (44.0%) fell short of the 11.79% cost of equity we estimated with CAPM.
Importance of Fee Income
Across all 3,853 community banks, noninterest income is the strongest single predictor of ROA (r = 0.64, explaining about 41% of the variation). NIM (r = 0.12) and asset size (r = 0.01) explain almost nothing. Being bigger does not make a community bank more profitable: average ROA is 1.28% for banks of $100–250 million and 1.39% for banks of $3–10 billion.
The pattern matches our earlier peer study of 16 banks in one state, where efficiency (r = −0.91) and fee income (r = 0.76) tracked ROA closely and NIM did not. Over a longer horizon the signal is sharper still, and over a five-year average for all banks between $100 million and $10 billion, noninterest income to average assets had a 0.90 correlation with ROA, the highest of 12 measures we tested. NIM (−0.01), net interest income to assets (−0.02), yield on earning assets (−0.03) and total assets (0.00) showed no relationship at all.
Margin income and fee income are not interchangeable dollars. Margin income needs a balance sheet: deposits to fund the loan, capital to back it, and credit and rate risk the bank must carry for years. It is also the revenue competitors attack first, through deposit rates and loan pricing. Fee income from treasury management, wealth, insurance, card, or loan hedges consumes little capital and little funding. Fee income drops almost straight to ROA/ROE, and it tends to move on a different cycle from the margin.
Fee income matters for four reasons:
- Direct contribution to income. A fee needs no funding and little capital, so most of it reaches the bottom line.
- It reflects value added. Customers pay fees for advice, risk management and convenience they cannot get on rate alone.
- It self-selects profitable clients. Businesses that buy treasury, hedging or wealth services tend to be larger, stickier and more profitable relationships.
- Less transparency is key. Loan and deposit rates are posted and shopped; bundled service fees are far harder for competitors to undercut.
The PPP lesson: What Fees Did For 2021 and 2022
Community banks have already seen what a surge of fee revenue does to earnings. Community banks made 60% of all PPP loans (according to the ICBA), and the SBA paid lenders processing fees of 5% on loans under $350,000, 3% up to $2 million and 1% above that.
The result showed up plainly in 2021 when community bank NIM fell 12 basis points to 3.27%, yet net income rose 29.3% to $32.7 billion and pretax ROA climbed 22 basis points to 1.52%. In Q3 2021 alone, fees recognized as PPP loans were paid off and forgiven helped lift community bank net interest income by $2.2 billion, or 11.7%.
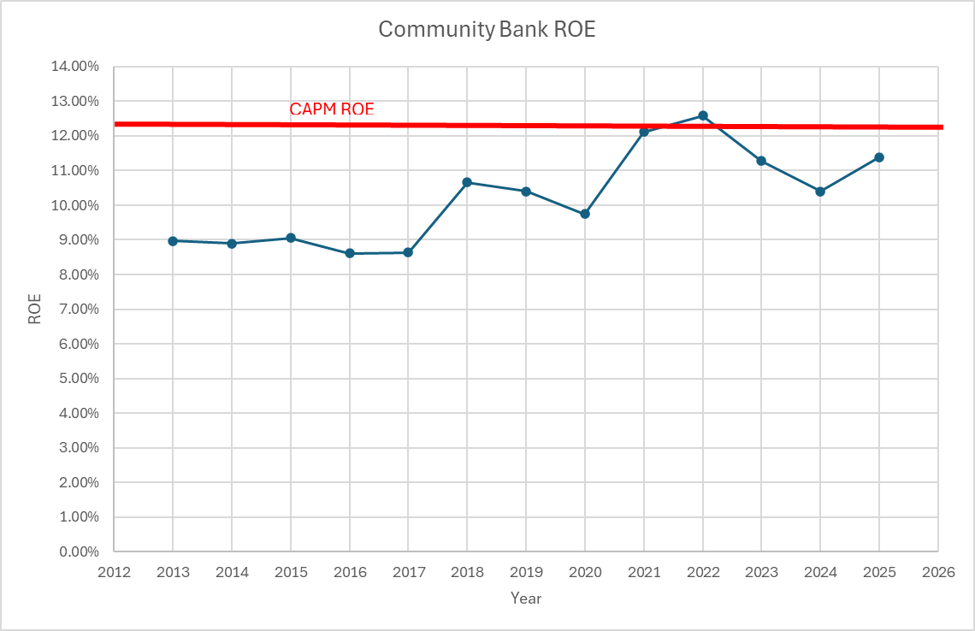
PPP balances at community banks fell 75% during 2021, and the rest ran off in 2022, and when the fees ended, so did the lift. The lesson is not that banks need another government program, it is that fee revenue moves ROA far more than a few basis points of margin. The graph below shows ROE for community banks from 2013 to 2025.
Why ROE And Not NIM Decides Which Bank Survives
Shareholders do not get paid in margin – they get paid in return on their capital, and they compare that return with what they could earn elsewhere for the same risk. The capital asset pricing model (CAPM) puts a number on that required return:
Cost of equity = risk free rate + beta X (broad market return minus risk free rate) = 4.90% + 1.30 X (10.2% – 4.90%) = 11.79%
Here the risk-free rate is the 10-year Treasury at 4.90%. The market risk premium is the S&P 500’s long-run 10.2% return minus that rate, or 5.30%. The 1.30 beta is our estimate for community banks, slightly above the KBW Nasdaq Bank Index’s long-run range of 1.10 to 1.32. Historically, bank cost of equity has run between 8% and 12%.
In Q3 2026, 1,694 community banks (44.0%) earned less than that 11.79% hurdle, even though the median bank earned 12.65%. A bank that persistently earns below its cost of equity is quietly destroying shareholder value, and its owners will eventually look for an exit. Our acquisition study found that ROE and ROA were the main predictors of which community banks survived independently over four years; NIM and credit quality, on their own, were not. From 2013 through 2025, average community bank ROE ran between roughly 8.6% and 12.6% and cleared 11.79% CAPM hurdle in only two years, 2021 and 2022, the years PPP fees flowed through earnings.
How Fee Income Lifts ROA in Practice
The most direct path is to attach fees to loans and deposits that banks already make. The average community bank replaces about 25% to 50% of its loan book every year, so its typical commercial loan lives only about two years. In our RAROC model, a standard $1 million CRE loan at SOFR + 2.50% takes three to four years to earn an acceptable ROE, because acquisition costs swamp a short revenue stream.
A 25 basis point hedge fee changes that math. The borrower pays the same all-in rate, the bank books an upfront fee in exchange for slightly lower margin (SOFR + 2.25%), and the loan’s ROE rises by about 4 percentage points in its first two years. The shorter the bank’s loan life, the more the fee is worth.
Beyond loan hedges, the levers are familiar but underused:
- Treasury management, priced and sold as a product, not given away to win deposits.
- Wealth, trust and insurance referrals or partnerships.
- Gain-on-sale lines such as SBA and residential mortgage.
- Card and payments revenue
Pricing tools (RAROC, funds transfer pricing, activity-based costing) are essential to show which relationships earn their capital. The math is meaningful, and a bank moving from the median fee level (0.43% of assets) to the top-fifth threshold (0.78%) adds 35 basis points of revenue to assets. Even after the cost of delivering it, that is enough to carry many banks across the 1% ROA line.
Conclusion
While Q3 2026 margins are healthy, over 1.1k of community banks still earn below a 1% ROA and nearly half fall short of their cost of equity. Size does not fix that, and more margin fixes it only partially. The banks at the top run efficiently and earn meaningful revenue that does not depend on the spread.
PPP showed how quickly fee revenue can lift earnings; its end showed how quickly the lift disappears when it is not built into the business. Community banks that want to stay independent should treat noninterest income as a strategic line of business, measured, priced and staffed like lending. If your team would like help building that plan, we are glad to analyze your bank and share recommendations.