How to Increase Bank ROA

Annually we study community banks’ performance to investigate which financial variables correlate to Bank ROA. We then explain that correlative relationship using further studies, analysis, and industry observations. We use average five-year ROA and measure the correlation coefficient (R2) for various financial variables. Over the years the relationship between NIM and ROA has been remarkably close to zero – until 2023. We explain what factors are the largest drivers of community bank ROA and why, for the first time in 15 years, NIM became slightly correlated with ROA.
Why is NIM Not Predictive of Bank ROA In the Long Run
A wider NIM does not lead banks to generate higher ROA because other factors (such as credit quality, loan size, prepayment speeds, and relationship value) are more important drivers of ROA over time. Loans are not fabricated by banks but instead are negotiated by borrowers and lenders in a broad, efficient market. If a bank can keep all other loan parameters the same and increase yield, then NIM will increase and so will ROA. However, that is an impossible task because the increase in yield leads to other important variables that adjust ROA back to the base case, and sometimes below the base case. The market for securities is highly efficient, and for loans it is efficient enough, that strong obligors with sizable credits and those willing to provide a total banking relationship with a lender also obtain lower-priced loans.
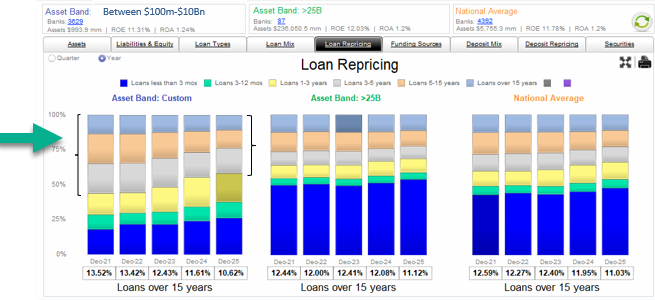
However, in 2023 the relationship between NIM and ROA strengthened (but only marginally). As the Federal Reserve increased short-term interest rates in 2022, banks with lower-priced fixed rate loans saw significant margin compression. Those banks that kept asset duration short were able to maintain stable NIM, but banks that increased asset duration were hurt with significantly lower NIM and lower ROA. Between 2022 and 2025 NIM became a predictor of ROA – but in a way that most bankers did not anticipate – stretching for a carry trade became counterproductive. The graph below shows how community banks (between $100mm and $10Bn in assets – left panel) carried unusually sizable percentage of fixed-rate loans ending in 2021 and then reversed that position over the next four years to reduce the mismatch. In contrast, banks over $25Bn in assets (middle panel) did not exhibit the same asset duration profile over that period.
Drivers of Community Bank ROA

The following conclusions are essential to note:
- Of the 12 variables, only two demonstrate a meaningful relationship to ROA (they appear at the top of the list).
- Non-interest income (fee income) is perennially the top variable correlated to ROA. There is a strong correlation between fee income and ROA, and we will have more detailed explanations of why this relationship exists in future articles.
- A semi-strong correlation exists between non-interest expense to average assets and ROA. But that correlation is positive, meaning higher costs lead to higher ROA. We are left to conclude that higher personnel expenses lead to better employees, which translates to higher ROA, or that location drives both employment costs and performance. In general, we believe that banks need to spend money to make money, and this is true for fee income generation.
- Asset size, asset yield, and interest expense demonstrate almost no correlation to ROA over the five-year historical period for community banks.
- NIM and NII have a moderate correlation to ROA as previously discussed. Charge offs are also negatively correlated to ROA (this is expected).
A powerful correlation exists between non-interest income to average assets and ROA. This analysis is not a causative study, and many reasons may explain this correlation. However, we surmise that non-interest income is crucial to bank performance because of the following reasons:
- It is a direct contribution to the bottom line that typically does not require additional assets.
- It demonstrates the ability of the bank to service high-net-worth customers that can afford to pay such fees.
- Fee income is an example of profitable cross-sell opportunities for banks.
- Non-interest income, in some cases, can be recognized by banks upfront, leading to a much higher ROA.
- We also believe that non-interest income is more accretive to ROA in a competitive loan environment as is the case in an expanding economy.
Our analysis cannot lead us to draw a causation between the 12 variables analyzed and ROA, but consistent results are indisputable – fee income is highly correlated to performance and stretching for NIM through a carry trade in extreme interest rate environments can hurt performance.
Conclusion
If community banks are to prosper, they must be able to measure the variables that lead to higher profitability (ROA and ROE, and preferably on a risk-adjusted and prepayment speed-adjusted calculation). We urge all community banks to adopt some form of RAROC loan pricing tools to increase performance and not simply measure yield or margin when making a credit decision. In our next article we will give some more consideration to non-interest income and how community banks should drive that portion of their business model.