Statistical Evidence on What Hurts Bank ROE
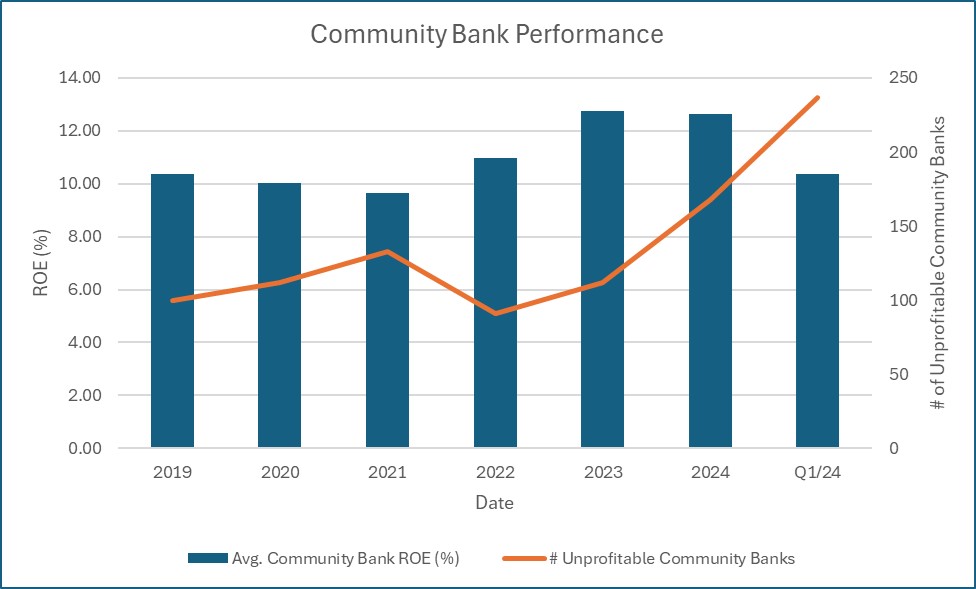
FDIC-insured “Problem Banks” list has been increasing over the past two years. For the community banking industry (banks under $10B in assets), this is particularly troubling as the number of community banks earning negative return on equity (ROE) spiked to 237 institutions in Q1/24, or 5.71% of all community banks. Bank ROE is now a problem. We aim to explain the reason for this spike in the percentage of unprofitable community banks so that bankers can better manage their business model.
The Data on Bank ROE
As shown in the graph below, community bank industry average ROE declined to 10.38% in Q1/24 from 12.63% in the prior quarter, and the number of banks reporting negative ROE in Q1/24 increased to 237 from 91 in 2022.

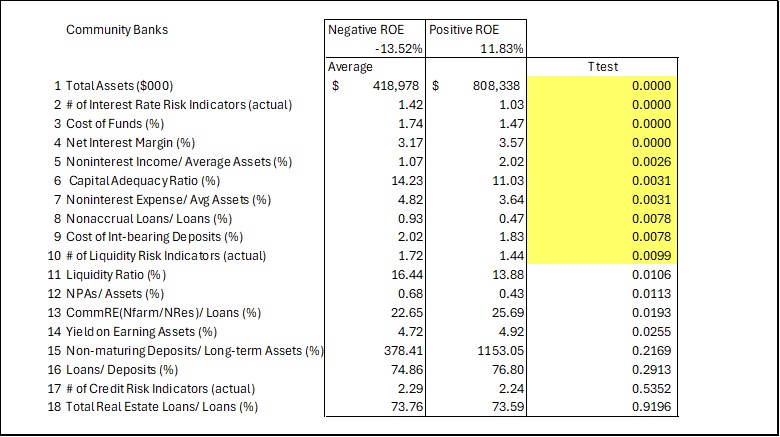
We analyzed the Q1/24 performance of community banks (4.3k in total) to better understand the causes of negative ROE. We considered 18 variables to explain the statistical significance using a T-test analysis between the positive and negative ROE bank group with a p-value of 0.01. The summary of our analysis appears in the table below.

The yellow-highlighted T-test values in the table above are statistically significant at p-value of less than 0.01. The analysis shows that smaller banks are more likely to generate a negative ROE. The biggest statistical predictor of negative ROE is interest rate risk – as measured by a number of variables in the table above: # of Interest Rate Risk Indicators, cost of funds (COF), net interest margin (NIM), and # of Liquidity Risk Indicators. Not surprisingly, community banks generating negative ROE in Q1/24 have higher cost of funds. It should be noted, that while NIM is also lower for these sub-performing banks, that relationship is driven primarily by interest paid on deposits vs. yield on earning assets (with the latter variable showing p-value of over 0.01). With the severity of interest rate hikes and reduction in market liquidity, those institutrions that did not prioritize deposit gathering and controlling COF have generated substandard Bank ROE.
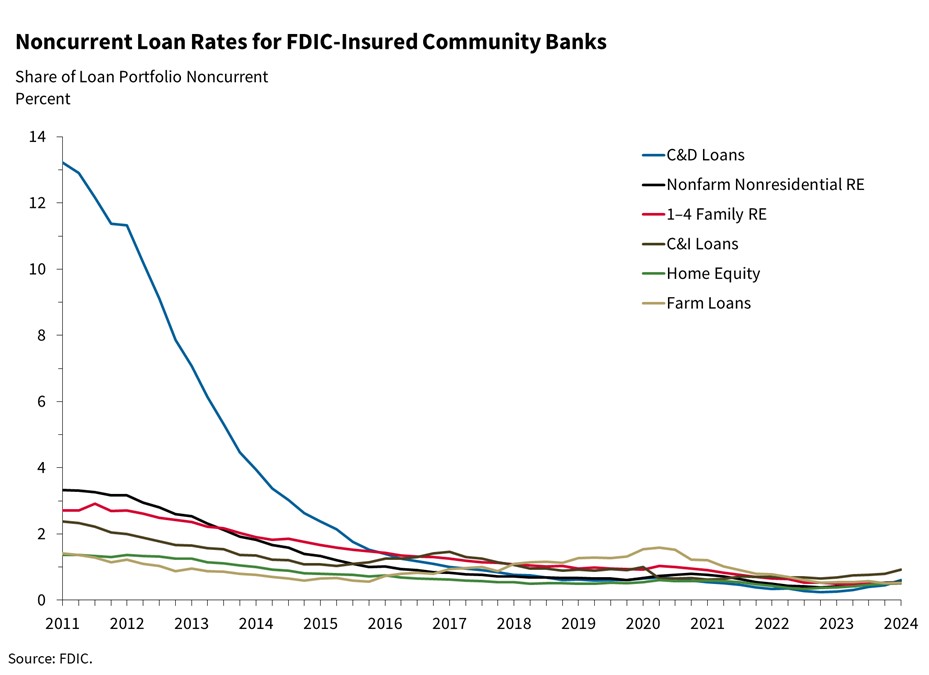
Asset quality (as measured by Nonaccrual Loans/Loans) is another predictor of performance. Despite rising, but relatively benign, noncurrent loan rates for community banks (as shown in the graph below), sub-performing banks have a larger share of credit problems.

Interestingly, but not surprising, non-interest income to average assets is another strong predictor of community banks performance. We have seen this relationship play out for banks of all sizes and over decades. Banks that can generate more non-interest income demonstrate higher ROE.
Capital adequacy is higher for banks with negative ROE and this relationship is statistically significant (negative ROE banks show higher capital levels). This may be the result of ownership bolstering capital levels to account for a perceived riskier business model, or a strategy of injecting additional capital for regulatory needs. It is noteworthy that our analysis does not show a relationship between performance and exposure to real estate, and specifically commercial real estate (both measures are not statistically significant for ROE).
Summary and Action Items
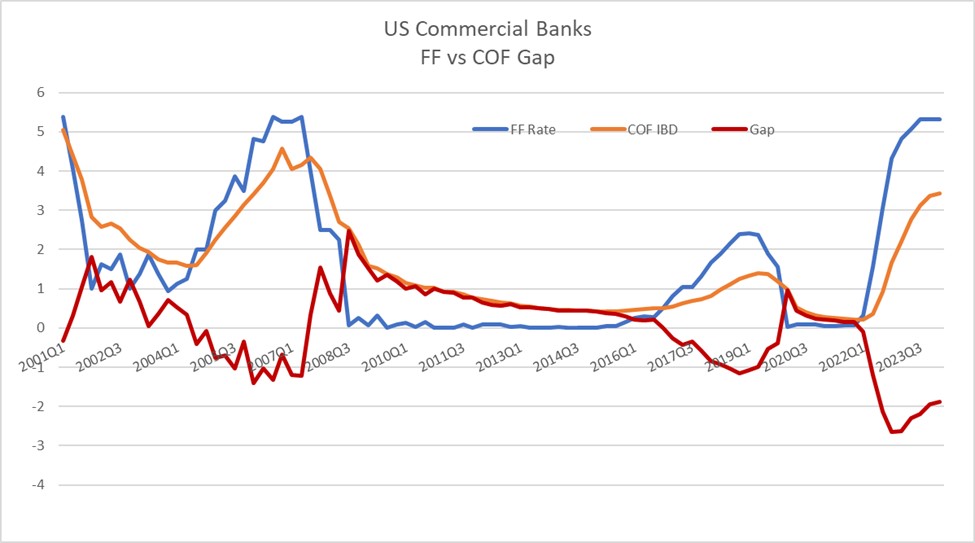
We believe that it will be tougher for many banks to bring in new deposits over the next 18 months, and there will be continued pressure on deposit costs at many banks. We highlight our previous argument that as long as the funding gap (difference between Fed Funds, as proxy for money market rates, and the industry’s COF interest bearing deposits (IBD)) stays higher than historical average (currently 1.88%, and historical average of zero), we expect deposit betas to increase, and COF for many banks to rise. The funding gap analysis is shown in the graph below.

The franchise value at community banks is low cost and sticky deposits. Community banks must be able to measure ROE on deposits, offer products that can attract lower cost deposits, hire chief deposit officers, and pay incentives for employees who can generate deposit driven ROE.

