What Drives ROA?

In a previous article (HERE), we analyzed industry performance and demonstrated that the average five-year net interest margin (NIM) and return on assets (ROA) are unrelated. The correlation coefficient (R2) between these two variables is NEGATIVE 0.02 (essentially no explanatory relationship). This lack of connection has been a general observation in the banking industry for decades. It supports the premise that banks that generate higher net interest margins are not more profitable as measured by ROA. However, other variables correlate to bank performance (as measured by ROA).
Why is NIM Not Predictive of ROA
The graph below shows a scatter diagram of NIM and ROA for all banks in the country (using average 5-year historical performance).
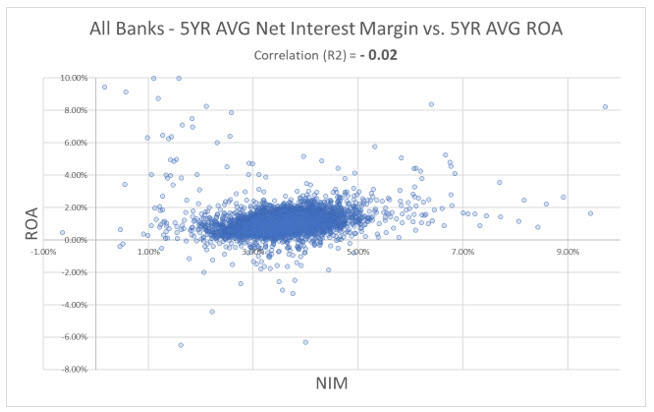
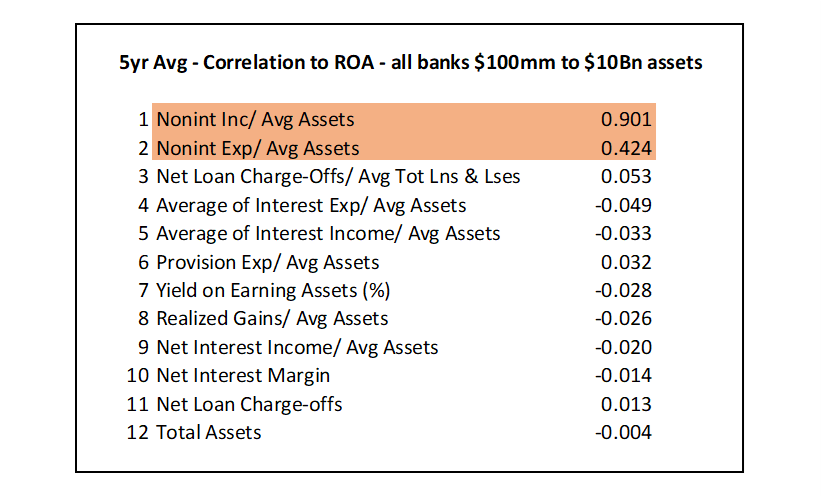
A wider NIM does not lead banks to generate a higher return on assets because other factors (such as credit quality, loan size, and relationship value) are more important drivers of ROA over time. We looked at 12 other variables for community banks (asset size $100mm to $10Bn) and measured the correlation between those variables and ROA over the past five years. The table below contains our output.
The following conclusions are essential to note:
- Of the 12 variables, only two demonstrate a meaningful relationship to ROA (they appear at the top of the list).
- Asset size, NIM, credit quality, asset yield, and interest expense do not demonstrate a correlation to ROA over the five-year historical period for community banks (asset size $100mm to $10Bn).
- A powerful correlation exists between non-interest income to average assets and ROA. This analysis is not a causation study, and many reasons may explain for this correlation. However, we surmise that non-interest income is crucial to bank performance because of the following reasons:
- It demonstrates the ability of the bank to service high-net-worth customers that can afford to pay such fees.
- Fee income is an example of profitable cross-sell opportunities for banks.
- Non-interest income, in some cases, can be recognized by banks upfront, leading to a much higher ROA.
- We also believe that non-interest income is more accretive to ROA in a rising interest rate environment, and this will be an interesting observation opportunity over the next couple of years.
- A strong correlation exists between non-interest expense to average assets and ROA. But that correlation is positive, meaning higher costs lead to higher returns. We are left to conclude that possibly higher personnel expenses lead to better employees, which translates to higher ROA, or that location drives both employment costs and performance.
In a previous blog, we argued that four general factors drive bank performance: industry specialization, market segments, location, and operating leverage. Our correlation analysis cannot confirm each of these four general factors because such granular data does not exist. However, this correlation analysis does demonstrate that higher non-interest income is highly correlated with higher ROA for banks between $100mm and $10Bn in asset size.
Conclusion
If community banks are to prosper, they must be able to measure the variables that lead to higher profitability. While not all community banks will adopt RAROC loan pricing tools to increase performance, many community banks have an opportunity to focus on services that can generate additional non-interest income. Non-interest income that can be recognized immediately into income (versus amortized over a longer period) appears to be a major driver of higher ROA for community banks.