
Loan Pricing Observations from H1 2026

We work with over a thousand community banks across the country. We observe and measure commercial loan pricing, seeing over a hundred commercial loans per week on average. Our bank customers range in size from under $100mm to over $10B in assets, and we see pricing on commercial loans as small as $200k and as large as $100mm. We measure the RAROC on many of the community bank loans quoted and booked through our Loan Command model. Our customer banks compete for commercial loan customers based on service, pricing, structure, and product offering. In this article we update our observations on commercial loan pricing trends, credit structures, and return calculations with data through the second quarter of 2026, and we place those observations in the context of the broader lending market.
Themes and Observations for Commercial Loans
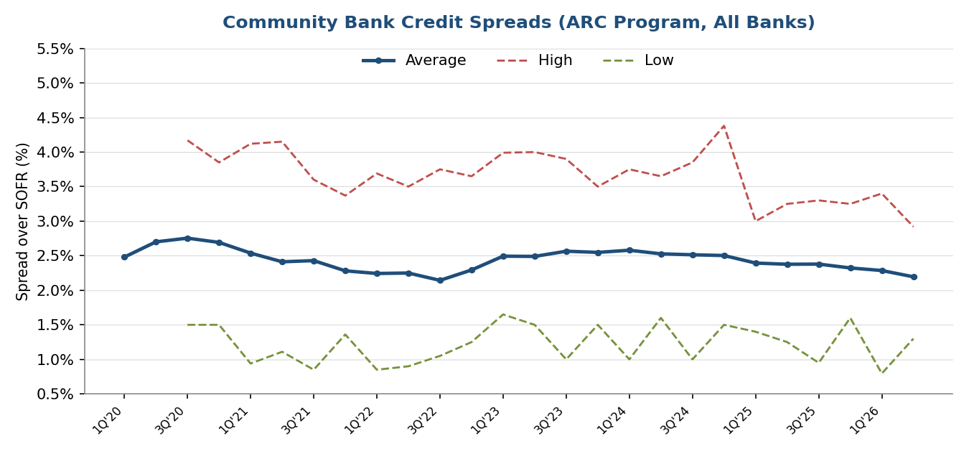
The average commercial loan size in our ARC program remains little over $3mm, with a range of $195k to $50mm. Measured across the full observation period (1Q 2020 through 2Q 2026), the average credit spread remains steady at 2.44% over SOFR. The more interesting story is at the margin: spreads have compressed in each of the last five quarters, falling from 2.50% in 4Q 2024 to 2.29% in 1Q 2026 and 2.19% in 2Q 2026. The 2Q 2026 average is the tightest quarterly reading since 3Q 2022 and the second tightest in the history of our data set. The dispersion of pricing also narrowed meaningfully: the widest spread we observed in 2Q 2026 was 2.92% (versus highs above 4.00% in 2021 and 2024), and the tightest was 1.30%. The graph below demonstrates the trend in credit spread (average, high, and low).
Loan structure has also evolved. Average maturity has shortened, from roughly 12 years in 2020 to about 6.0 years in the first half of 2026, while average amortization has lengthened to 23.3 years – the longest of the observation period. Borrowers are locking shorter commitment windows against longer amortization schedules, a structure that increases refinancing (and repricing) risk for borrowers and banks.
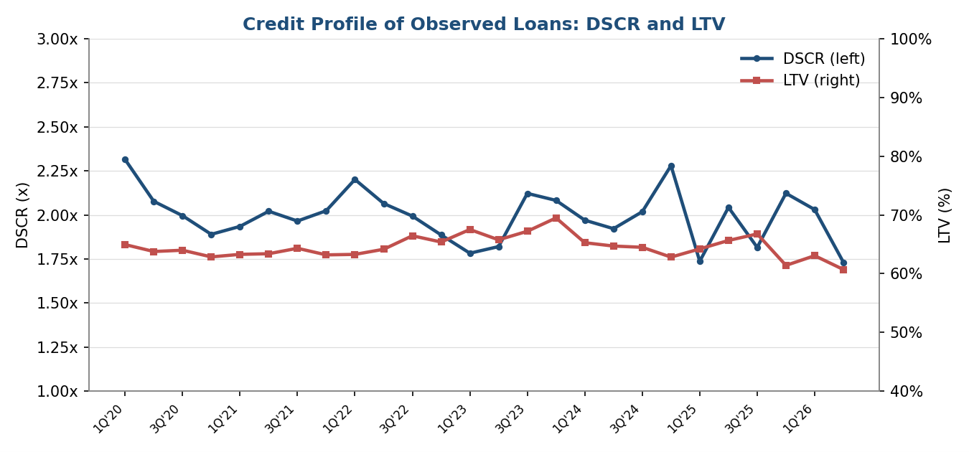
The credit profile of this same group of commercial loans appears in the graph below. For the first half of 2026, average DSCR is 1.88x (1.73x in 2Q alone) and average LTV is 61.9% – the LTV reading of 60.7% in 2Q 2026 is among the most conservative in the data set. The long-running correlation persists: larger loans, higher credit quality, and longer terms all tend to be priced at narrower credit spreads.
ROE Explanation for Commercial Loans
There are some interesting takeaways from this observed data. First, the loans in this data set are large – on average almost ten times larger than the average community bank commercial loan. Second, they are relationship credits with strong prepayment provisions and longer expected lives. Third, the credit quality is superior to the average credit, and in 2026 it improved further even as spreads tightened.
The market, in a broad sense, prices to risk-adjusted return on capital (RAROC), not to credit spread. We priced the average community bank loan ($350k, 3-year term, 1.25x DSCR, 75% LTV, and a 2.75% credit spread) against the average loan observed in our ARC program (approximately $3mm, roughly 6-year commitment, 1.88x DSCR, 62% LTV, and a 2.24% credit spread), excluding any non-hedge fee income, cross-sell (such as deposits), or upsell opportunities. Despite the thinner pricing, the larger loan’s size, credit quality, and commitment term produce an economic ROE of approximately 17.6%. The smaller, shorter, less credit-worthy loan produces an economic ROE of approximately 10.2% – which is close to the average industry ROE.
While not every loan originated at a community bank can be $3mm with stellar credit quality, to achieve top performance banks must seek such credits and price them accordingly. These modeled ROEs exclude crucial contributors such as fee income, deposits, and other cross-sell businesses, but the results establish an important directional opportunity for community banks.
Market Context
Our observations are consistent with the broader commercial lending market in the first half of 2026. Other market observations show floating-rate C&I spreads settling near 2.15% over SOFR in early 2026 – essentially on top of our 2Q 2026 ARC average, with spreads trending lower since the start of 2025 amid the Federal Reserve’s rate cuts and intense competition for quality deals. Crisil Coalition Greenwich attributes the tightening of C&I and CRE spreads to Fed easing and heightened bank competition, noting a recovery in CRE origination and renewal volume. In short: more volume, more competition, thinner spreads leads to an environment in which disciplined, return-based pricing matters more, not less.
Community Bank Pricing vs. the Non-Investment Grade Syndicated Market
The final graph places community bank pricing alongside the broader non-investment grade loan market as of mid-2026.
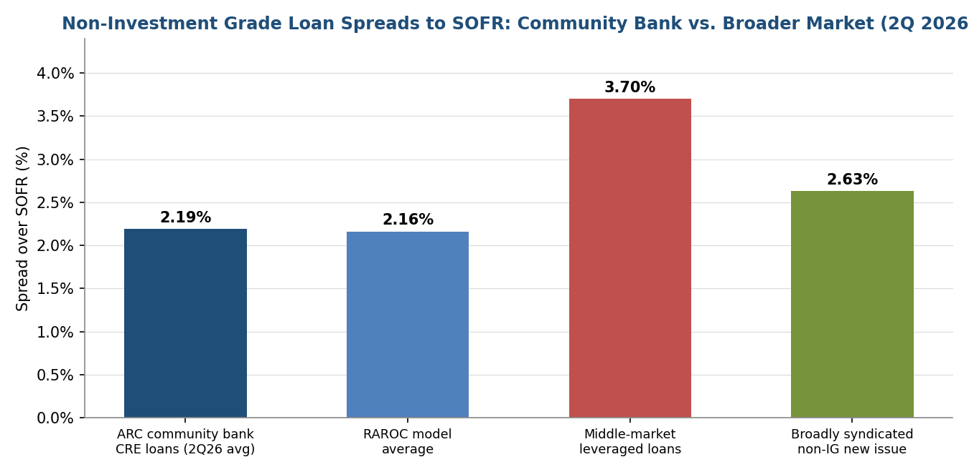
Spread over SOFR: ARC program average (observed), RAROC model average, and published market levels. Sources: Capstone Partners / Federal Reserve Bank of St. Louis (middle-market leveraged, ~3.7%); Bloomberg (broadly syndicated non-investment grade new issue, 2.63%).
Community banks in our program priced their average commercial credit at 2.19% over SOFR in 2Q 2026, essentially in line with our RAROC model average of 2.16%, and roughly 44 basis points inside the average broadly syndicated non-investment grade new issue at 2.63% (per Bloomberg). We underscore that broadly syndicated non-investment grade loans are typically not relationship credits for participant banks. Middle-market sponsored leveraged loans remain the wide outlier at approximately 3.7% over SOFR. But again, these loans are not relationship opportunities for participant banks and reflect weaker credit quality. This graph reflects spreads only and not underlying credit risk, or cross-sell and upsell opportunities. On a RAROC basis, relationship accounts outperform strictly credit products.
Conclusion
In the community banking industry, a small number of relationships generate the bulk of the profits. Most relationships are breakeven, and a few detract from ROE with negative contribution to overhead. Banks report and gauge performance based on the sum of individual accounts, but within that average there is tremendous opportunity. The first half of 2026 sharpened the point – spreads are contracting and rising competition mean that the margin for error has narrowed. Bankers can improve performance by allocating resources to retaining and attracting top accounts, migrating mediocre accounts to profitability, and understanding the cost of doing business with negative-ROE clients. In a market where everyone’s spread is compressing, the banks that price to risk-adjusted return – and structure for term, size, and credit quality – will own a disproportionate share of the industry’s profits.