Current Commercial Loan Pricing Trends for 3Q 2025

In contrast to 2Q where the market overreacted (in retrospect) to tariffs, government cuts, and immigration reform, 3Q is built around a return to normal theme. Banks increased lending supply and credit performance remained stable. In this article, we will break down detailed commercial loan pricing data and highlight both trends and insights into 4Q.
The big positive news in 3Q is that commercial real estate prices finally started to climb as larger institutional buyers came back into the market on the expectation that recession was not imminent and we may get some relief in rates. This was true for primary, secondary and tertiary markets across the U.S. Many of these REIT, pension funds, investment firms, and asset managers believed inflation would remain high and that the forward curve had too many rate cuts built in so have opted for more long-term financing believing that long-term rates will rise and the yield curve will steepen.
Commercial Loan Pricing Trends
While we touched on our general commercial loan pricing trends earlier last month (HERE), we go more in-depth in this article.
As banks put more credit supply back out in the market, aggregate commercial loan pricing tightened from a weighted average of 2.63% in 2Q to 2.31% in 3Q. The median commercial loan spread was approximately +2.47 in 3Q to date. In terms of risk-adjusted return on equity (ROE) targets, it was a bifurcated market. Some banks have chosen the strategy to tighten pricing and volume while moving up in credit quality, while the majority of the banks have continued to seek loan growth across the spectrum of credit.
Loan pricing details by credit grade and sector can be seen below.
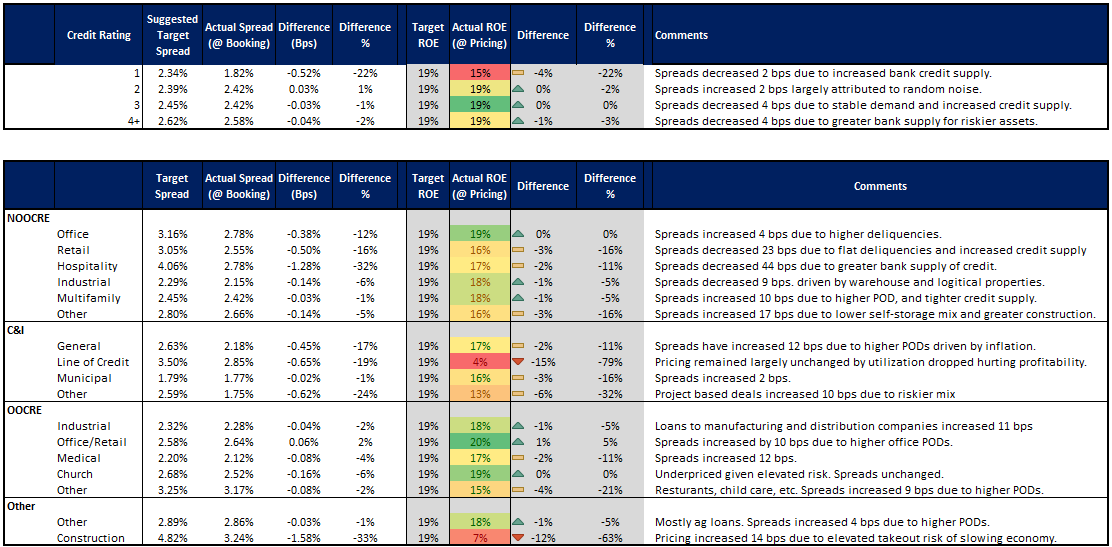
While credit spreads tightened, upfront loan fees increased by six basis points to an average of 36 basis points.
Banks continued to place fixed rate loans on their books, particularly in the five-year area, expressing the view (either on purpose or accidentally) that rates are going to drop more than the 100 bps that is already built in and largely ignoring the threat of inflation. Banks that have the opposite view have been focused on booking adjustable loans, or hedging loans with programs similar to our ARC Program.
In a related view, bank borrowers are still experiencing rate shocks as a material percentage of loans originated at the end of 2020 and during 2021 continue to reset higher helping margins but hurting credit. This continues to be a risk for banks for another 12 months.
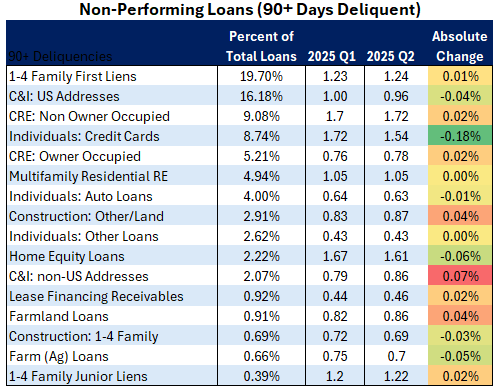
From a high level, delinquencies remained reasonable and below average. For commercial lending, construction increased four basis points (bps) and non-owner occupied CRE increased two bps. These delinquency trends had minor impact on pricing.
Current Loan Pricing Trends by Sector
C&I lending slowed slightly due to some credit concerns with the headline industries driven by tariff concern getting hit the hardest. Banks increased pricing on new customers, while existing customers saw a pricing reduction by about 10 bps.
As many C&I sectors have elevated probabilities of defaults (POD), credit line usage was down, hurting profitability. For both term loans and lines of credit, banks increased pricing as the quality of credit demand skewed to a higher credit risk.
For CRE, banks were slow to put on retail and office exposure, but the new credits that were booked were well underwritten. Pricing increased for Office (but within the bounds of randomness) and Retail investor-owned properties decreased 23 bps as credit quality continues to improve due to stronger underwriting. Owner-occupied retail saw an 8 bps increase in credit spreads due to a tepid outlook on retail sales growth.
Without new supply on the horizon, low rents, high vacancies, and increasing foot traffic have helped bank credit. However, banks need to be cautious of exposure to slowing sales growth (economic slowing and inflation) and growing vacancies. The string of bankruptcies and location closure announcements is now starting to filter into the local markets. Bank exposure to retail centers with pharmacies (Rite-Aid), merchants (Joann), and chain restaurants (Hooters, Denny’s, and Applebee’s in particular). Vacancy rates have increased from 4.1% to 4.3% as a result. On a net basis, PODs are forecasted to increase through 2026, hurting Retail lending performance.
Multifamily
Multifamily, which contributed to some credit concern last quarter, continues to stabilize thanks to slowing new apartment completion and strong absorption. Credit quality for this product is extremely local but there has been a drop in future building permits due to ample supply in many markets and higher rates. As such, the outlook continues improving. Projected vacancy (below) is expected to stay below 8% for the rest of 2025 and should be lower than 7.75% for 2026. While slowing immigration will continue to hurt leasing and rents, 4Q multifamily credit is expected to benefit from a 1.5% rent growth (which is down from 2.4% from the start of the year).

Similar to multifamily, the industrial sector abated its slide and pricing decreased for investor properties but increased for owner-occupied properties. Manufacturing activity continues to contract due to the uncertainty in the trade environment which has also caused a slowdown in new construction in this sector. Trade uncertainty continues to elevate PODs for logistics and warehouse properties while the One Big Beautiful Bill Act provides further tax benefits for properties related to chip manufacturing and defense contractors (which have lower PODs).
Hospitality
Hospitality is a notable subsector where banks continue to lend, pricing incongruently tightened, and banks continue to underprice the risk. Granted, spreads blew out in 2Q on the back of tariff and international travel concerns, so some tightening was warranted, but the picture still points to a risk-off approach for banks.
Quarter-to-date, hotel revenue per room continues to decline (below), down approximately 1.5% from June, due to slightly lower rates (down 0.2%) and lower occupancy. Houston, Chicago, and Las Vegas are geographies that are leading the decline while most classes are getting hit except for the Luxury level. The Economy class is fairing the worst with revenue-per-room down some 3.3% according to CoStar.

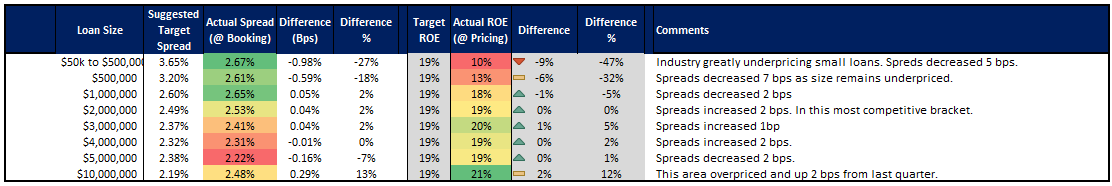
Pricing by Loan Size
The banking industry still does not have an appreciation for funds transfer pricing when it comes to loan origination and often misallocate capital. Like almost every quarter we have seen in banking, banks usually underprice commercial loans below $500,000 and ironically overpriced larger sized loans. We start to see this in loans above $5mm, acutely see this in the $10mm loan size range and then moderate as loan size approaches $25mm.
Putting This into Action
Overall, the current loan pricing trends indicate a dynamic landscape with varied performance across sectors that are more volatile than they have been in the last three years. While Commercial and Industrial, and Medical loans show promising potential with tightened spreads, sectors like Retail, and Hospitality present a mixed but deteriorating outlook.
Banks must continue to navigate the intricate balance of competitive pricing, strategic structuring, and profitability management to optimize their loan portfolios effectively. Having a risk-adjusted relationship profitability model with updated probabilities of default and loss given defaults, similar to Loan Command, is more important than ever.
To download a copy of the pricing matrix, click below.
![]()