How to Manage Your Efficiency Ratio with Loan Size
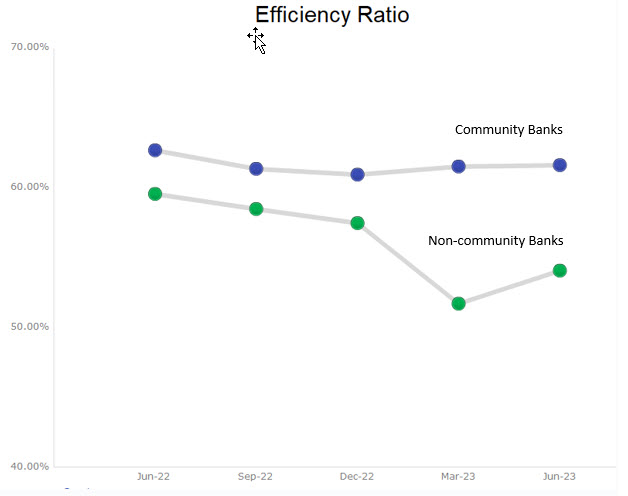
The banking industry’s average efficiency ratio worsened for the first time since 2021. The industry’s efficiency ratio increased to 54.30% in Q2/23 from 52.98% in Q1/23. This development is very important to community banks, as their efficiency ratio also increased, but to 61.63%. The national banks have already indicated how they plan to reverse the efficiency ratio increase – through headcount reduction. However, we believe that community banks should consider a different strategy since community banks’ much higher efficiency ratio results from a different driver.
The Efficiency Ratio Data
The efficiency ratio is calculated as noninterest expense divided by the sum of net interest income and noninterest revenue. The industry’s increase in efficiency ratio resulted primarily from a decline in non-interest income and an increase in non-interest expense. The graph below shows the efficiency ratio for community and non-community banks (over $10B in assets).

The national banks have been clear and loud about how they intend to decrease their efficiency ratios – with headcount reductions. The industry has already reported a 0.65% decrease in full-time employees QoQ in Q2/23. Truist, Citigroup, PNC, Royal Bank of Canada, Wells, Bank of America, and others have all announced aggressive cost reductions centered around headcount. However, headcount reduction is not the primary driver that will decrease efficiency ratios at community banks.
When we compare the differences between community banks and larger competitors and then analyze the data for net overhead-to-earning-assets, salaries-per-full-time-employees, premises and equipment costs, and net income, net revenue, assets, and deposits per employee, it underscores how community banks are negatively impacted by scale during times of low credit risk. Community banks are dealing with smaller relationships (both loans and deposits) that are not being charged appropriately to cover overhead costs.
What is Driving the Efficiency Ratio at Community Banks?
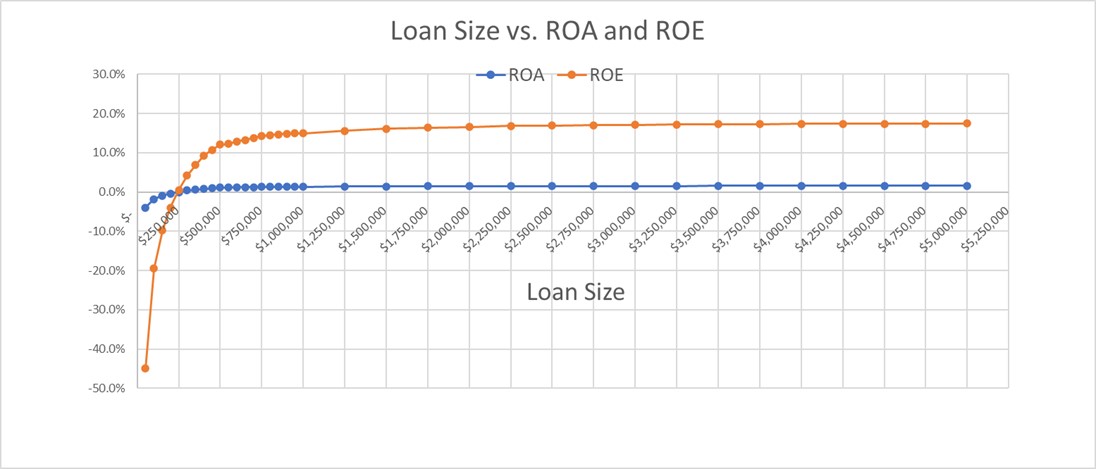
We priced an owner-occupied commercial real estate (OOCRE) credit for an average community bank (average cost of funds, acquisition, and maintenance costs) and varied the loan size between $50k and $5mm. All other parameters (credit quality, spread, fee income, cross-sell opportunity, amortization, term) stayed the same. The relationship between loan size and ROA and ROE is shown in the graph below.

The analysis demonstrates that without substantial reliance on technology, automation, or both, community banks are challenged to show positive return on equity (ROE) or return on assets (ROA) for loans below $250k in size. Yet the average community bank’s commercial loan size is about $250k. Conversely, the benefit of size in driving ROE/ROA is very modest for loans over $1mm in size. To state it another way, a $1mm OOCRE credit (75 loan-to-value (LTV), 1.25x debt service coverage ratio (DSCR)) demonstrates a healthy 15% ROE at a five-year fixed at 6.67% or 2.25% equivalent credit spread. The same loan, just changing the loan size to $50k, would require a 9.15% credit spread to achieve a 15% ROE. If your bank’s average commercial loan size is below $1mm, your bank has a tremendous incentive to increase the average loan size to decrease the efficiency ratio and increase the bank’s ROE/ROA.
Industry Comparisons
Many community bankers will argue that their business model differs from the national banks and that their customers are dictating a smaller average relationship. We agree but will contend that smaller loans must be priced appropriately with higher credit spreads to compensate community banks for the inefficiency of dealing with smaller relationships.
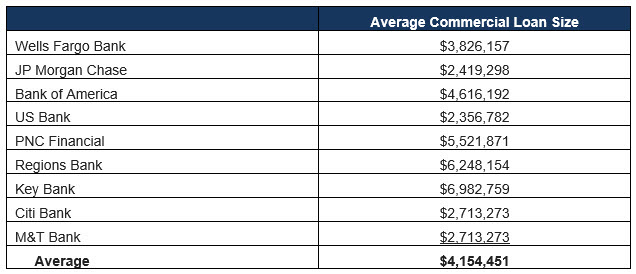
Further, national banks’ average commercial loan size is not as large as many will guess. It isn’t easy to assess the average loan size across various banks or asset bands because banks do not report total loans on the balance sheet. However, select national banks do report their new loan originations and the number of loans booked in a period. Below is a table showing the average loan sizes for commercial real estate (CRE) originations we analyzed a few years ago.

These average loan sizes at national banks are not outside the capacity of the average community bank. Further, research shows that a bank with more than 100 loans has a fully diversified portfolio of credits. Anything above 100 loans has little impact on credit risk through diversification effects. Further, banks could achieve much greater credit diversification by managing the industries and geography they lend to than by managing loan size. Therefore, the argument for smaller loan sizes and higher diversification to minimize credit risk is not strong.
Conclusion
We recommend that all community banks take another look at how they price loans based on the relationship size (taking into account loan and deposit balances and ancillary product sales). Bankers should be proactive in setting risk-adjusted ROE targets to meet their strategic and tactical goals. That is, bank managers should incent the desired portfolio construction.
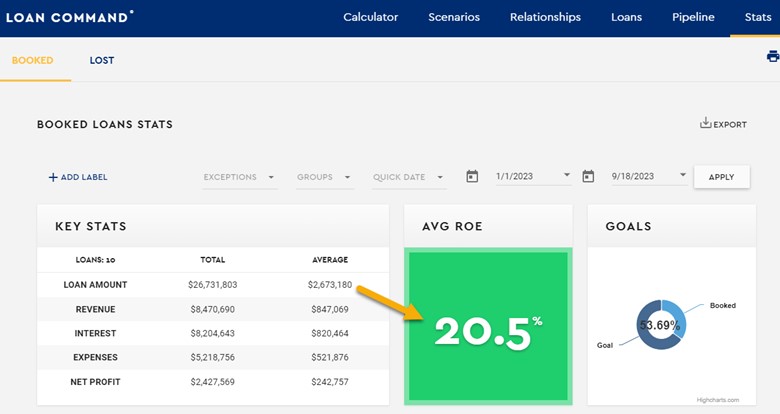
Offering attractive pricing for quality loans that add scale, loans that add diversification, and loans that come with deposits or high fees are all tactics to proactively design a credit and customer portfolio. As can be seen in the example bank below, an average loan size above $2.6mm is a substantial driver of profitability. A strong focus on a risk-adjusted return on capital (or RAROC) loan pricing model, such as Loan Command, can substantially decrease efficiency ratios, reduce risk, and increase ROE/ROA.


