The Effects of Inflation on CRE Cashflow

At a cursory observation, one would conclude that the effects of inflation on a real estate project are neutral. If owners can pass increased costs to tenants, they can keep inflation from decreasing NOI or cash-on-cash return. However, closer analysis and lessons from history demonstrate that to counteract inflation’s free cash flow-destroying effects, revenue must grow substantially higher than the inflation rate. Managers who grew CRE value in the last 40 years (when inflation was tame) may be unable to preserve real estate value or maintain cash flow when inflation is 6% to 10%, especially if inflation is volatile. Bankers must understand inflation’s value-destroying effects on CRE for underwriting and loan pricing purposes.
Sensitivity Analysis
A sensitivity analysis tests assumptions for lenders to use to assess a project’s ability to service debt. Usually, this method tests one variable through the life of the loan to analyze the impact on the debt service coverage ratio (DSCR). The variables that banks typically test are amortization periods, interest rates, vacancy rates, and lease rates. However, in the last 25 years, we have yet to see a community bank perform sensitivity analysis on inflation rates – for obvious reasons. However, now is the time to analyze and understand how inflation affects CRE net operating income (NOI), DSCR, and free cash flow.
The table below is a sensitivity analysis of inflation (assumed to be 6%) and measures the sensitivity of revenue and expenses on a CRE property. The table shows major income statement lines and measures NOI and free cash flow growth rates. We specifically excluded debt costs/benefits on free cash flow to eliminate the possibility of distortion from mispriced credit (NOI calculations would not change with debt included). However, banks (and owners) could include the effect of debt for sensitivity analysis for free cash flow for their specific analysis.
This table assumes that management can pass along 70% of inflation to tenants, and 100% of inflation passes through expenses. The expense sensitivity at 100% is a typical assumption, but the revenue sensitivity depends on the property type. Revenue is more sensitive to inflation for hospitality (close to 100%) and much lower for office (ranging between 60% and 80%). However, 70% revenue sensitivity to inflation is an average figure for CRE projects.
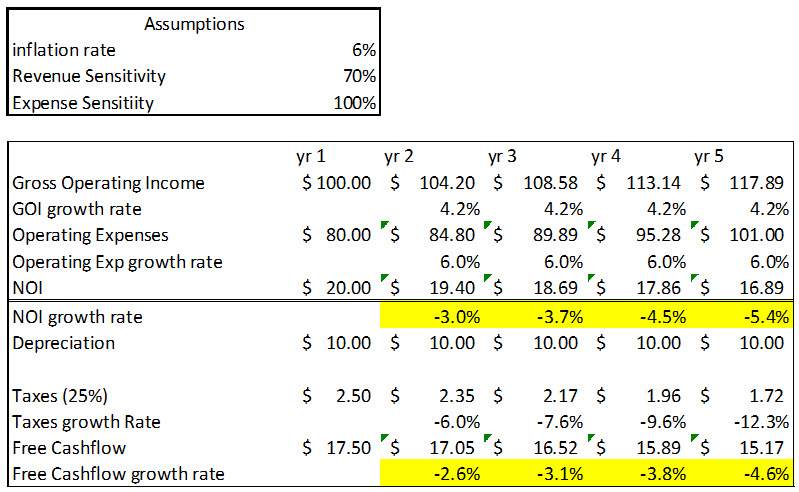
The conclusions from the table above are as follows:
- For the average CRE project (where management can pass only 70% of inflation to increase rents to tenants), inflation leads to a substantial loss of NOI and free cash flow. We will assess various revenue sensitivity assumptions below.
- The biggest threat to CRE projects lies in management’s inability to pass cost increases to tenants. This happens when leases are longer term (beyond one year) and do not have inflation escalation clauses or are not triple net leases. However, even for triple net leases, the problem with free cash flow is not eliminated (as discussed below).
- The free cash flow sheltering effect of depreciation makes CRE a poor performer with higher inflation. Depreciation stays constant until fixed assets are added; however, this occurs over long periods for CRE projects. As annual depreciation (over 20 to 30 years) remains constant, free cash flow declines even if revenue keeps up with inflation (more on this below).
We can change our assumption about revenue sensitivity to inflation. For example, while a triple net lease might have close to 100% revenue sensitivity, office or retail categories might have 60% revenue sensitivity, and multifamily might be between 70% and 80%, depending on local rent laws. The two graphs below show revenue sensitivity ranging from 70% (CRE average) to 100% (triple net lease). The graphs show NOI and free cash flow growth rates for four revenue sensitivity assumptions.

The higher the revenue sensitivity, the better NOI and free cash flow performance. However, even with 100% revenue sensitivity to inflation, while the NOI growth keeps pace with inflation, free cash flow never reaches 6% – meaning that the real estate value decreases yearly. This happens because the invested capital (fixed depreciable assets) has a long life and is not replenished; therefore, depreciation does not grow to shelter tax payments and results in free cash flow falling below inflation every year.
History Lesson
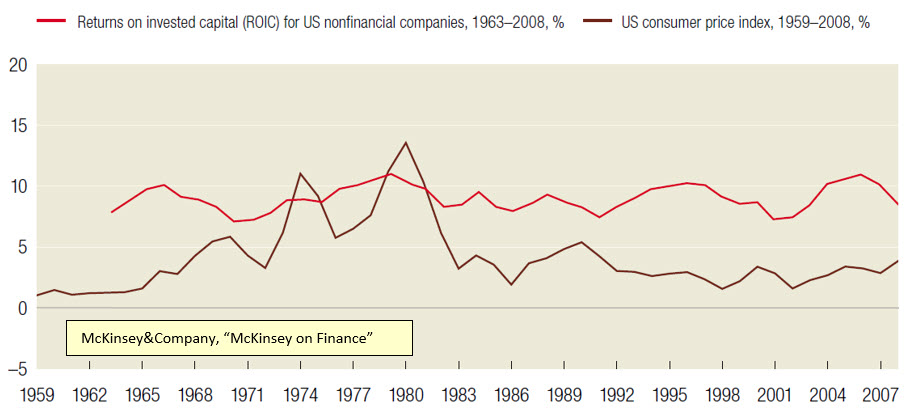
One reason central banks want to keep inflation low (at 2%) is that non-financial companies outperform in low-inflation environments. Managers find it challenging to create value when inflation exceeds long-term average levels above 2% or when it is unpredictable. This occurs for real estate properties, manufacturing, and technology companies. The biggest threat from inflation is that most companies cannot pass the full inflation rate to customers. Further, our tax system penalizes free cash flow generation when inflation is high because of the nature of fixed asset depreciation.
The graph below shows the CPI index and return on invested capital (ROIC) for US non-financial companies. During periods of inflation, US companies have not been able to pass along the higher costs from inflation to customers, leading to ROIC below the inflation rate. US corporate’s ROIC is relatively steady and does not increase with inflation. Therefore, US corporates can add value to shareholders when inflation is low but destroy shareholder value when inflation rises.
Conclusion
There is more to inflation’s effect on CRE DSCR, NOI, and free cash flow than meets the eye. Bankers that have never had to deal with inflation’s impact on lending may be advised to review how higher inflation rates influence their borrower’s repayment capacity and run sensitivity analysis between inflation and DSCR, NOI, and free cash flow.