
What You Need to Know About Forward Looking Bank Credit

Bank credit has been an interesting road over the past year, and it is about to get more interesting. Despite higher inflation, a tariff shock, immigration policies and general volatility, probabilities of defaults, and loss given defaults have improved. Yet, despite that, bank credit has deteriorated slightly. How is this possible? We explore the data and our model to help you see the future.
Bank Credit Background
Last year, our 1-year forward looking probabilities of default was at 3.57% for the average community bank credit (small business and middle market) in the United States. Currently, this number is at 2.48%. With a 26% average loss given default, that is a 31% improvement in banks’ expected loss at 65 basis points. Currently, for 3Q 2026, community banks are reserved in the 1.36% range. This is positive.
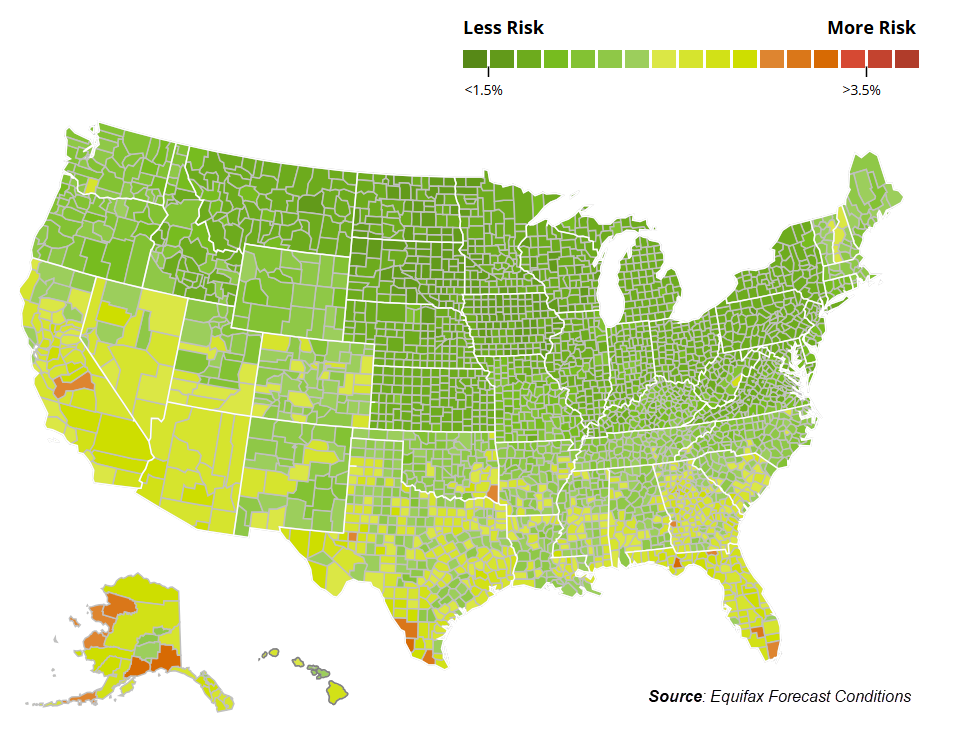
Risks to the revised credit outlook in community banking appear balanced in terms of probability, the magnitude of the downside risk seems larger. While a national recession appears unlikely in the near term, knowledge-industry payrolls have been stagnant over the past few years despite growing output. Persistent inflation and higher interest rates could slow economic growth further and precipitate additional business cost-cutting even in an environment of continued economic expansion. Furthermore, the recent productivity gains evident in knowledge work could accelerate with further adoption of artificial intelligence, resulting in lower demand for some types of knowledge workers.
Why Bank Credit is Better Than Expected
The short answer is, in general, the consumer is still strong. Despite a current slowdown and cracks in credit, the consumer is still spending. Conversely, we over indexed on the impact of inflation, tariffs and immigration (hurting labor costs). In our defense, a large portion of the tariffs were reversed, and the full impact of loose monetary and fiscal policy has remained to be seen.
Further, credit conditions across U.S. businesses remain highly uneven. At the broad industry level, probability of default is generally moving in the right direction, but looking beneath those headline numbers reveals meaningful pockets of emerging risk.
What Is Doing Well, and Not so Well?
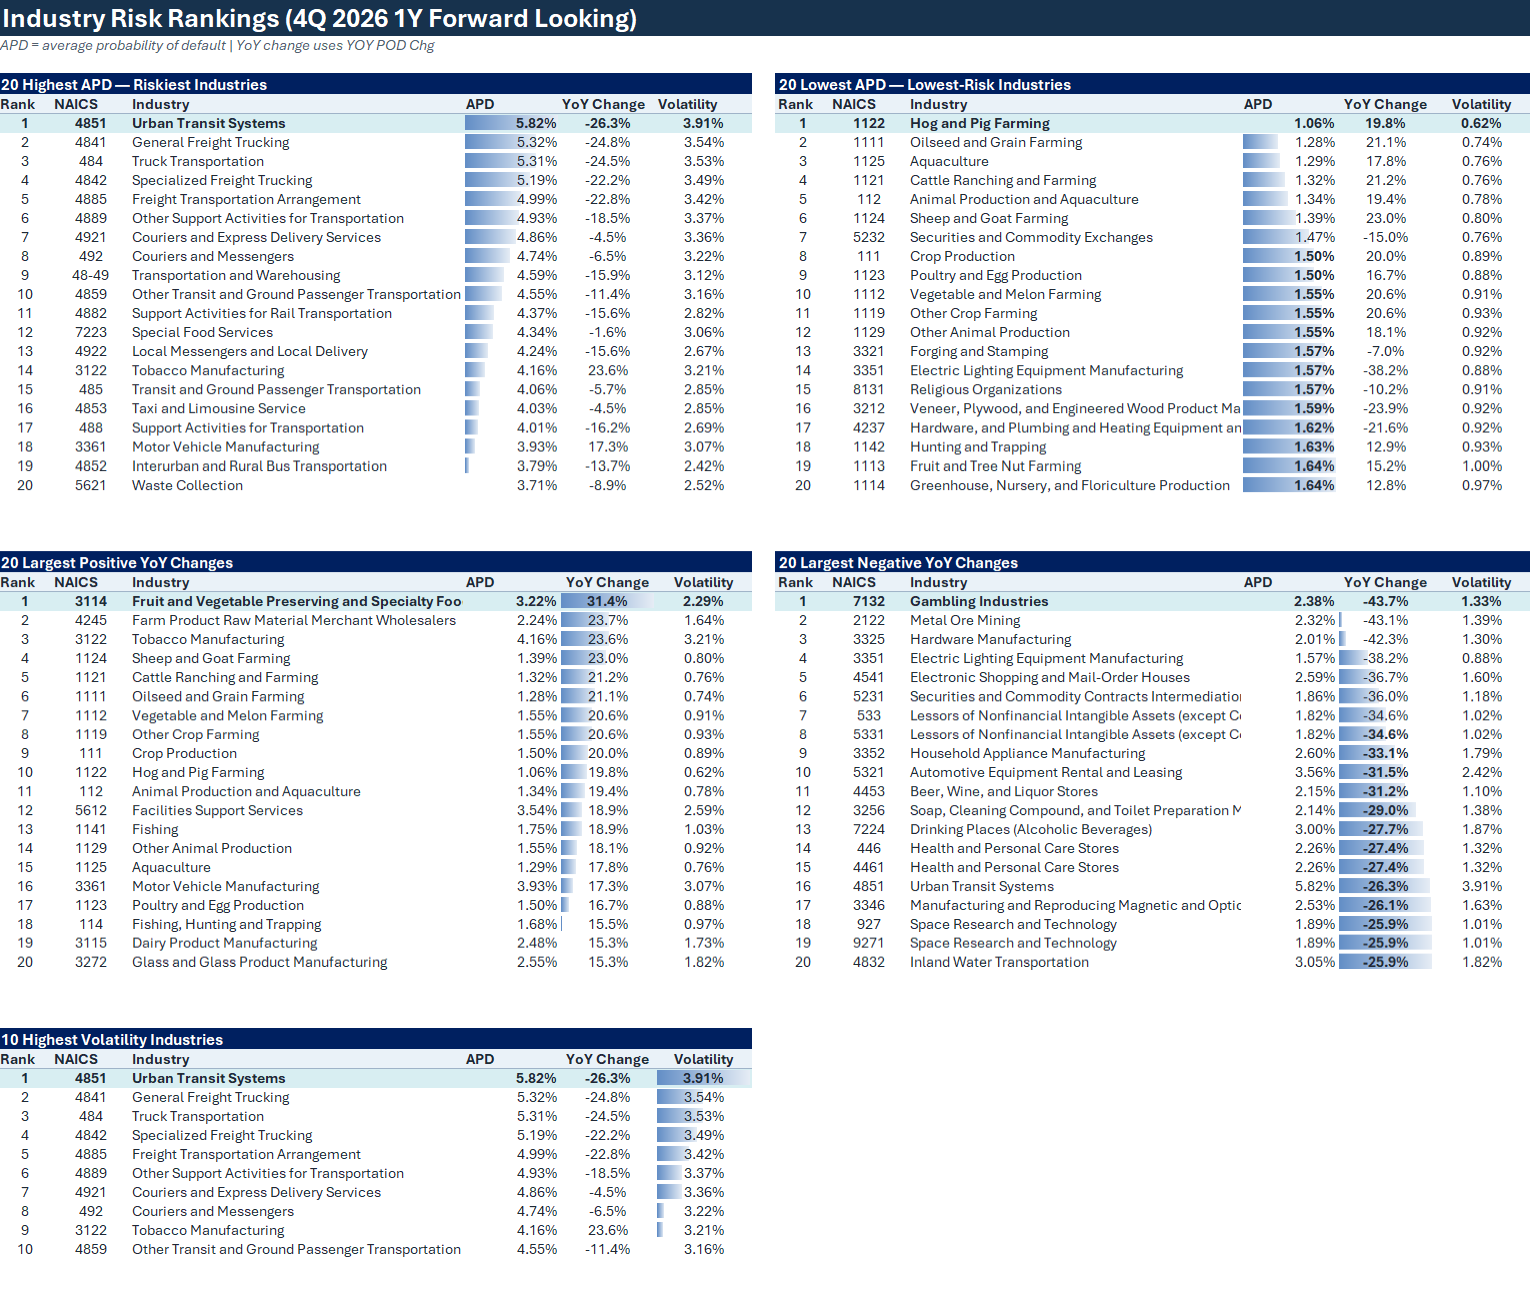
Among the major economic sectors, Transportation and Warehousing credit remains the highest-risk category, with an average probability of default (APD) of 4.59%. Accommodation and Food Services follows at 3.45%. Both these sectors were expected to get devastated by tariffs and inflation and while both were hurt, they did better than expected.
At the other end of the spectrum, Agriculture, Forestry, Fishing and Hunting has the lowest broad-sector average probability of default (APD) at 1.71%, followed by Finance and Insurance at 1.84%, Professional, Scientific and Technical Services at 2.16%, and Wholesale Trade at 2.20%.
The Safest Sectors Aren’t Necessarily Becoming Safer
Agriculture illustrates the opposite phenomenon. It remains the safest broad sector at 1.71% APD, yet its probability of default increased 25 basis points year over year, the largest deterioration among the major sectors shown.
In terms of net change, Fruit and Vegetable Preserving and Specialty Food Manufacturing (3114) recorded a 101-basis-point increase year over year. By contrast, Electronic Shopping and Mail-Order Houses (4541) declined 95 basis points, Gambling Industries (7132) declined 104 basis points, and Automotive Equipment Rental and Leasing (5321) declined 112 basis points.
These movements reinforce an important point: industry selection increasingly matters. Two borrowers operating under the same broad sector can face substantially different credit environments once lenders drill into the underlying NAICS industry. To survive the backend of the credit cycle, banks need a risk-adjusted return on capital model now more than ever.
Commercial Real Estate
The better-than-expected expected loss trend, but greater volatility also pertains to commercial real estate. Delinquency rates remain historically low across most capital channels, but they are increasing.
Commercial real estate borrowers are showing more signs of stress because of the environment resulting in weaker property performance. This issue is compounded by the fact that there is a wave of maturing loans that make it harder for some borrowers to keep their debt current in the face of lower expected net operating income and higher interest rates.
The share of commercial mortgages that were delinquent increased during the third quarter, according to the latest Commercial Real Estate Finance Loan Performance Survey from the Mortgage Bankers Association (MBA).
Office Risk
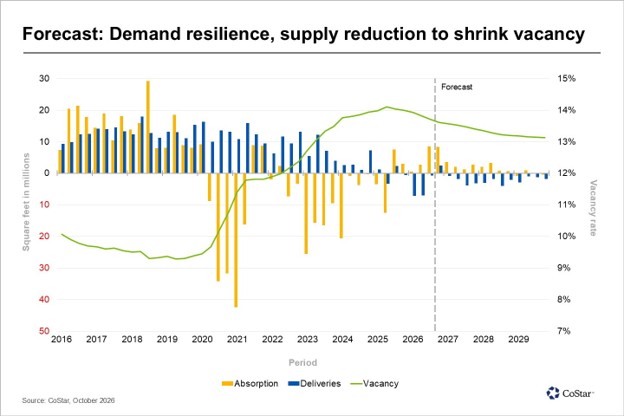
Office continues to recover for banks as the national vacancy rate has decreased some 50 basis points since peaking in mid-2025. We look for office to continue its slow, but steady climb out of the danger zone of potential bank credit issues. While office demand remains weak, low supply continues to help absorption and support rents.
Unfortunately, office properties continue to have the highest delinquency rates and presents banks with their greatest current risk. Borrowers are confronting difficult conditions in the office just as a large number of mortgages are scheduled to mature, forcing owners to refinance or otherwise address their debt while interest rates remain a considerable obstacle.
The clearest signs of trouble are showing up in CMBS loans. The proportion of CMBS loan balances that were at least 30 days delinquent climbed to 4.97% from 4.82% in the third quarter.
That contrasts with loans held by banks, life insurance companies and government-sponsored enterprises such as Fannie Mae and Freddie Mac, where delinquency rates remained substantially lower.
CoStar predicts that the national office vacancy rate is now forecast to end the year at 13.6%, slightly lower than the prior forecast of 13.7%. The outlook for office rent growth has also improved, with average market asking rents now expected to increase at a year-over-year rate of about 2.5% for the next few quarters before accelerating above 3% toward the end of 2027.
Commercial Property Loss Given Defaults
Similar to probabilities of defaults, commercial real estate valuations, and impact on loss given defaults are becoming increasingly uneven.
You can see how the differences sharpened during 3Q when you look at CoStar’s Commercial Repeat Sale Indices tracking price changes by comparing properties that have sold at least twice. Industrial prices rose in CoStar’s equal-weighted, value-weighted and prime-market indexes, while prime office values jumped 9.8% from a year earlier and apartment prices declined across all three measures.
The takeaway for bankers here is that headlines about commercial real estate price trends increasingly tell only part of the story. While investors are paying more for some sought-after properties, particularly top-tier offices and industrial buildings, demand is not uniform. Multifamily, as an example, remain under pressure as we predicted last year. The divide is especially stark in office, where prices in major markets jumped even as a broader measure of office property values fell 1.5%.
The pricing shifts come as commercial real estate investors contend with persistently high borrowing costs.
Industrial Remains Hot
Industrial properties stood apart because valuations rose uniformly and PODs rose just slightly to 1.14%. On average, valuations for industrial properties rose 5.4% in the 12 months through September, while prime industrial markets gained 8.5%.
However, industrial properties are losing some momentum as the financing environment becomes more challenging. Year-over-year transaction growth has slowed for five consecutive quarters. The market is still advancing, just with less verve.
Retail Prices Edge Higher
PODs on retail properties rose slightly to 2.41%. Retail valuations also increased, though more modestly. Retail valuations rose 3.5% in the 12 months through September, compared with gains of 0.5% in prime retail markets. As retail continues to recover from lower systemic demand, tight supply is helping bank loan performance. As such, rents and valuations for retail are fairly predictable for the next year and expected to remain within a narrow range.
Multifamily Are Bank’s Largest Problem
Multifamily has done so well for so long that we are seeing a secular shift in bank credit. Valuations are declining across every measure. Average property valuations fell 4.6% in the 12 months through September, while prices in prime multifamily markets declined 3.6%. Of all the commercial real estate subsectors, probabilities of default rose, more than 150 basis points to 1.98%.
That made multifamily the only one of the four major property types to record a year-over-year decline in the value-weighted measure.
Hospitality
Hotel pricing also weakened. The average hospitality property valuation in the United States fell 2.4% from a year earlier and 2.8% from the second quarter slightly hurting loss given defaults. However, hospitality has been one of the best performing bank loan sectors garnering + 300 basis point pricing while improving net operating income.
Revenue per available room (RevPAR) increased 12.6% year over year. Hotel demand again played a significant role in the increase, rising 5.2% and adding roughly 1.4 million room nights from the comparable week last year. That demand growth was accompanied by a 7.4% increase in average daily rate (ADR). If this demand surge continues through the rest of the year, and we predict it will, full-year U.S. hotel demand will likely be the largest ever recorded surpassing the previous record set in 2019.
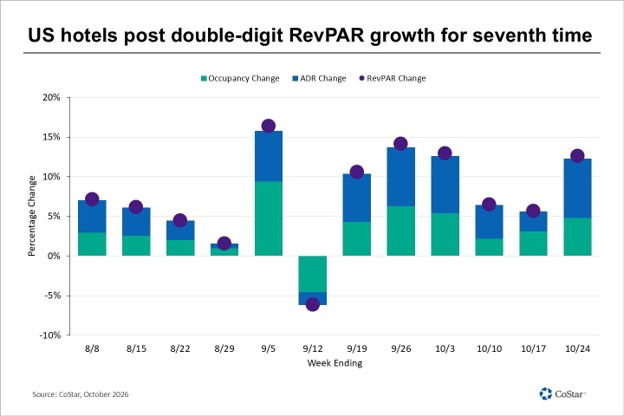
Performance was strong across hotel classes, with every class except economy (+8.8%) posting double-digit RevPAR growth. Luxury and upper-upscale hotels combined for a 13.4% RevPAR increase, an important indicator given that the government shutdown’s impact last year was disproportionately concentrated among lower-tier hotels. Strength at the upper end provides additional evidence that the week’s growth wasn’t solely a product of the easier 2025 comparison.
Putting This Into Action
The bottom line is that while credit is better than historic average this is the time to pay attention. Average probabilities of default have fallen meaningfully from a year ago, yet the improvement is uneven. Some of the safest sectors are drifting the wrong way, while pockets of risk, such as office and multifamily, continue to challenge bank portfolios even as industrial, retail and hospitality hold up. Headline probability of default numbers only tell part of the story. The banks that perform best through the back end of this cycle will be the ones that look beneath the sector level to the underlying NAICS industry, property type and market, and then price, reserve and underwrite accordingly with a risk-adjusted return on capital discipline.
Bankers who understand where probabilities of default are heading, not just where they have been, will be best positioned to grow with confidence and allocate capital efficiently.
For a complete list of our probabilities of default go here:
The tool featured in this article lives in our free portal, next to the resources, dashboards, and calculators that over a thousand community banks use to make sharper decisions.You've read the article. Now use the tool.