Bank Funding Cost and Deposit Beta Update

Knowing the correlation of interest rates to your bank funding cost is critical. For years, community bankers believed that their deposit base is sticky, relationship-driven, and too lightly priced to move much when interest rates change. By corollary, if your cost of funds barely budges when the Fed acts, you can hold longer-dated fixed-rate loans without much margin risk. This is an interesting story, but the data shows otherwise. And in mid-2026, with the rate outlook turning back toward higher-for-longer and even renewed hikes, getting this analysis wrong can become expensive. Every year we analyze the industry’s cost of funding earning assets (COF) and track how community bank’s COF behaves relative to larger banks and how COF moves with short-term market rates (SOFR).
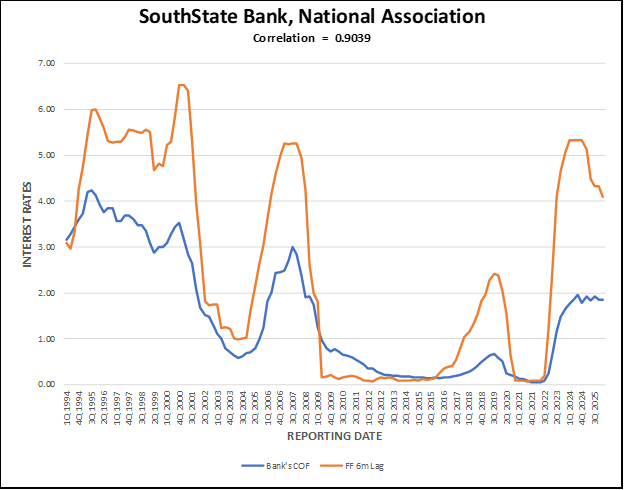
Bank Funding Cost Correlation
We examine the existing 4k+ FDIC-insured commercial banks, credit unions, and S&L associations from 1984 to the present. We look at the quarterly bank funding cost for various bank asset sizes and consider COF correlation to SOFR over that period – the banking industry’s R2 0.860 (highly correlated). For our own bank, for example, the R2 is 0.904: graph shown below.
The False Hypothesis of Bank Funding Cost Betas
The relationship between short-term rates and a bank’s COF is not instantaneous, which obscures the relationship. COF lags the index – the best fit emerges at roughly a six-month lag. That lag is partly what creates the false sense of security. When the Fed first moves, deposit costs do not jump the next morning, so a banker watching only the current quarter concludes the linkage is weak. Wait two quarters and the pass-through arrives. Correlation, of course, is not causation, and many uncontrollable variables shape the precise timing – but the strength and persistence of the relationship across four decades is hard to dismiss.
Why does the whole system track short rates so tightly even though community banks rarely peg deposits to an index? Because the largest banks do. A handful of national banks control more than half the industry’s deposits, price to wholesale benchmarks, and run rigorous funds transfer pricing (FTP). Everyone else competes for deposits in the market those banks set. A community bank in Ohio may never mention an index on a CD rate sheet, but it is still swimming in the same pricing current. When the national players raise deposit rates to defend balances, local banks eventually follow or lose funding.
Will DDA Cushion Erode or Strengthen
The historical correlation already shows that non-interest-bearing demand deposits insulate a bank less than its ALCO would like to believe. The more crucial point for the years ahead is that the cushion is shrinking. Two structural forces are working to convert idle, non-interest-bearing balances into interest-bearing and rate-sensitive money.
The first is tokenized deposits. Tokenization does not change the legal nature of the deposit claim – under a proposed 2026 FDIC framework, a tokenized deposit is still recorded as a deposit liability, simply represented on a distributed ledger, and distinguished from a payment stablecoin. What it changes is functionality: it makes bank money portable, programmable, and usable in always-on, 24/7 payment and settlement environments. The trend is no longer theoretical. A number of national banks have been running tokenized deposits and tokenized cash around the clock for B2B payments, treasury movements, and programmable cash applications. As that functionality spreads, the competitive bar for transaction balances rises commercial clients come to expect real-time movement, automation, and treasury optimization rather than parking large idle balances in a traditional operating account. The same payment innovation that lowers friction also lowers the operational cost of moving cash out of low- or non-yielding accounts, which is exactly what erodes the DDA franchise. Regulators, central banks, and investors have flagged the broader version of this risk – that digital-money alternatives can displace or restructure bank funding depending on what customers convert into and where reserves sit.
The second force is digital-first and online banks, which have already demonstrated how fast a digital competitor can reprice. Research covering the recent tightening cycle found that online banks passed rate increases through to depositors faster than branch-based banks, opening a sizable spread between the two within a year of the Fed’s first 2022 hike. Online banks have grown their deposits roughly thirtyfold since 2001, several times faster than traditional banks. The mechanism matters: once customers are accustomed to rate transparency and frictionless, app-based account opening, franchise inertia loses its value. Excess consumer and small-business balances that once sat quietly in checking become candidates to be swept into high-yield savings, money market funds, or digitally enabled treasury products the moment rates make it worthwhile.
Put together, tokenization compresses the operational value of leaving cash in a non-yielding account, while online competitors compress the value of customer inertia. Both push more balances into explicitly interest-bearing categories and raise the share of funding that reprices with the market. That is directly consistent with the broader cost-of-funds evidence: funding costs track short rates with a lag rather than staying permanently anchored.
How to Apply to Your Bank
In this environment, loan duration becomes dangerous for community banks. A fixed-rate loan locks in today’s yield for years. If a bank books a three, five or ten-year fixed loan at current rates and your cost of funds then climbs with a rising SOFR over the following quarters, NIM compresses. Variable-rate loans avoid this because their yields reset upward alongside funding costs, so the spread holds roughly constant. The buckets of a loan portfolio that hurt most in a rising-rate environment are precisely the long, fixed-rate ones; the variable buckets are the ones that protect you. In past tightening cycles, as with this possible next one, banks under $3 billion in assets were extending loan duration even as the largest banks shortened theirs – the same behavior is seen now.
Now is the time for community banks to be deliberate about loan duration. With markets no longer pricing cuts and increasingly pricing hikes, loading the balance sheet with long-dated fixed-rate paper means locking in today’s yield while accepting funding costs that the historical record says will follow short rates higher. The prudent responses are familiar: use loan level hedging, keep new fixed-rate origination shorter, and stress-test the deposit book against a realistic deposit beta rather than the wishful small number that feels intuitive. For institutions that want or need to keep originating long fixed-rate loans for competitive or relationship reasons, hedging may be the correct solution.
The single most useful exercise is also the simplest: pull your own bank’s COF history against short rates and compute the correlation. If you would like, send us an email and we will be happy to send you the analysis. Every bank should have an understanding of how their bank funding cost is correlated to interest rates and then takes steps to make it less correlated while bringing your asset duration lower.
Ask for the analysis today.