How to Steer Deposit Performance Like an F1 Car

In F1: The Movie, Brad Pitt’s character tries to tell his experienced team that “The corners are for combat,” which is a little like telling a banker that customer service is essential. Regardless of the obviousness, the point stands that in F1 racing, cornering takes precision, confidence, and nerves of steel. A F1 driver must have the skill to balance power and traction while handling the competition. Managing exception pricing deposit performance is the same. This article highlights how scoring your depositors can get you that balance against the competition.
Like a bank CEO, an F1 CEO must manage the technical aspects of the cars while building a talented team within a strategy and a budget. Perhaps no sport is closer to the intricacies of running a bank. This is in part because of the outsized role that strategy, tactics, and data play in success in all F1 endeavors. Deposit exception pricing management is an example of this. When a customer complains and you need to offer a bespoke deposit rate, it pays to have a framework and a plan.
Understanding Your Car
In F1 racing, your car’s design, quality, and setup to match track conditions account for about 70% of performance. The engine, aerodynamics, tires, suspension, and innovation all play a critical role. The same goes for deposit performance. A bank’s deposit engine should be built on gathering the least interest rate-sensitive customer base possible.

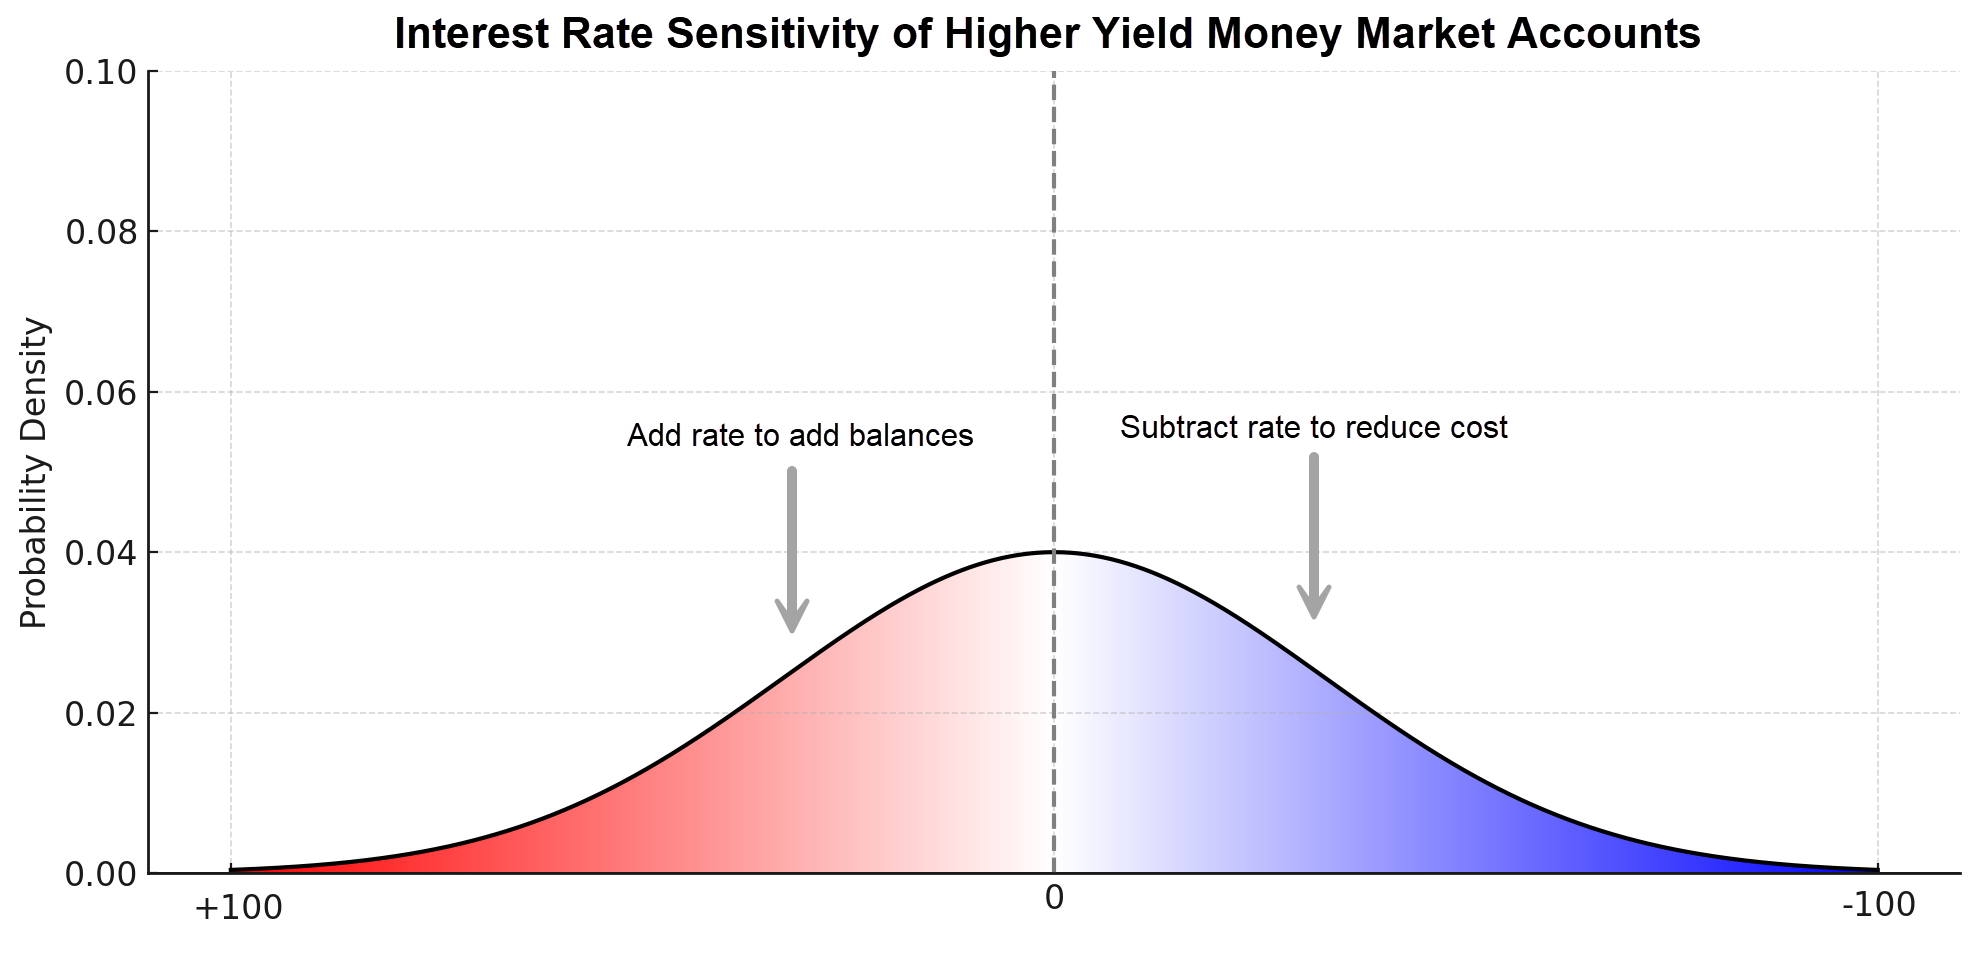
For example, when building a fast F1 car, you need data. For deposit performance, the data comes in the form of an interest rate sensitivity rating. As previously mentioned (HERE), we rank customers and deposit products on a score of +100 to -100. At +100, you have the interest rate sensitivity of SOFR, or a beta of “1,” and at -100, you exhibit 0 correlation to interest rates.
For context, a higher-performing deposit bank will have a composite sensitivity score of around -50, while a low-performing deposit bank will score in the +70 area.
Two Major Factors in Deposit Performance
While many factors influence deposit performance, such as geography, customer mix, brand power, and product mix, two of the most important are your bank’s offered rate and the alternative market rate. This alternative market rate can be another competing institution’s deposit rates, a money market mutual fund, or an alternative investment such as equities.
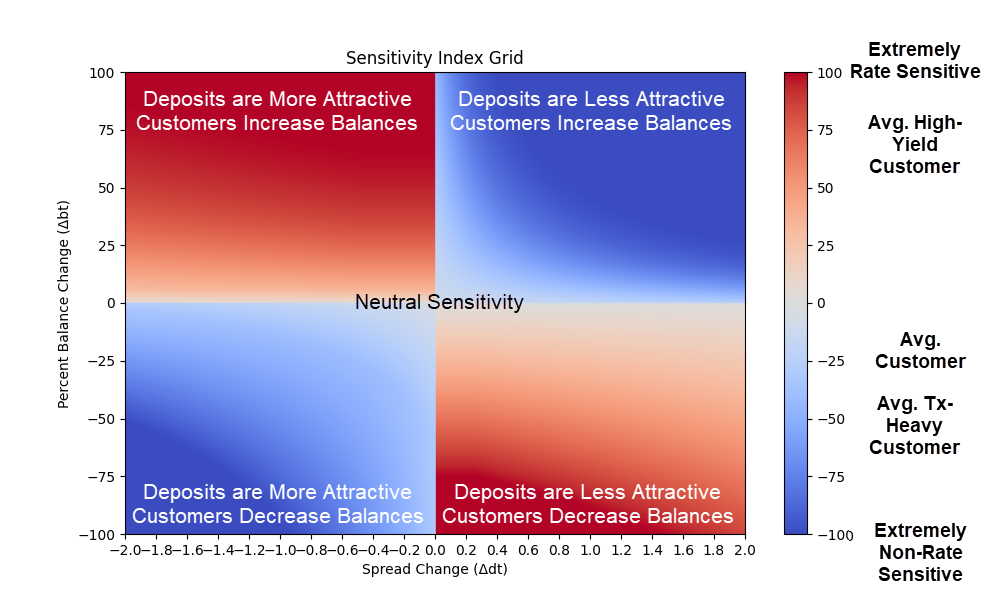
For the sake of this article, we will isolate these two factors and use the matrix below to help us understand the interplay between a bank’s offered rate and an alternative rate, which we call the deposit “spread.” In addition, we chart the balance change as a result of that spread change.
The left hand side of the grid represents when spread contracts and a bank’s deposit offering rate becomes relatively more attractive, while the right hand side is the opposite. The top section is the representation of when balances increase and the bottom half of the grid is when balances decrease as a result of the spread.
For the sake of this analysis, we will also focus on customers, but understand that these ratings can be calculated for products, geographies, branches, industries, and other customer segments. It is also important to understand that while changes in the sensitivity ratings tend to be slow-moving, they do change depending on the market environment, customer outlook, or bank tactics.
We can derive four quadrants and then rank customers into one of the four, depending on their performance.
The Top Left – Your Most Interest Rate Sensitive Customers
When you increase your deposit pricing relative to the competition, you decrease the spread difference between your bank’s rate and the alternative market rate. Customers who add balances from other institutions or other investments exhibit interest rate sensitivity. Small rate changes that result in large balance changes move a customer to a score of +100, and they are denoted in dark red. These customers have a hair trigger around interest rate sensitivity.
Bottom Right – Your Second Most Interest Rate Sensitive Customers
In a similar fashion, when you lower your rate relative to the market (your spread increases), and customers reduce their balances, that is also an indication of interest rate sensitivity. These customers tend to be a little less sensitive, and it takes more balance movement to approach +100.
Top Right – Your Least Interest Rate Sensitive Customers
Alternatively, when you increase your spread by lowering your rates relative to the market and balances increase, your customers are managing their balances using something other than rates. This could be your brand, your service, their lack of focus on rates, separate cash flow needs, or their reliance on payment transactions. These are the customers you want to cultivate and train.
Bottom Left – Your Next Most Valuable Customers
When your bank increases your deposit rates relative to the market (your spread-to-market decreases) and customers decrease balances, that is also an indication that these customers care about something other than rate.
Sensitivity Rating as Your Steering Wheel
Once you have your sensitivities, you can use the scores to measure deposit performance. Equally important is using the scores to evoke a desired behavior or outcome.
For example, if you want to lower your cost of funds, you can reduce the rates paid to the least interest rate sensitive customers, or those with scores below -20. Conversely, if you want to raise deposits, you want to go to those customers with scores above +80 and offer them a rate in exchange for balances. Here, offering a rate will increase the sensitivity of this customer segment, but this is your least valuable segment, so that the damage can be controlled.
The Driver’s Impact on Deposit Performance
Of course, as you build your car in F1, the driver is the other major predictor of performance. A good driver knows how to push the car to the limit and can provide valuable feedback to the engineering team to help design a faster car.
While we will go into more depth in the future around many of these lessons, here is a quick rundown of some driver-centric takeaways culled from the data:
- Service/brand Sensitivity: Just like customers are rate-sensitive, the same data can be used to determine service/brand sensitivity. Customers who approach -100 are either influenced by the bank’s service/brand or have reactions that are largely outside the bank’s control. Drive service and brand forward to make your deposit car go faster.
- Product Design: Creating more value to a product, such as the introduction of instant payments, is the fastest way to lower sensitivity scores, as more customers will start to value service. This is one under-appreciated aspect of bank product design. One bank (HERE) introduced security features to its savings account and dramatically shifted the value proposition away from rate sensitivity. A fast car is more than just a big engine. Design products with attributes that attract and retain service-oriented customers, and your deposit car will go faster in the turns and the straights.
- Length of Service & Cross-sell: The length of time a customer has been with your bank and the number of products they have with your bank accounts for -60% of interest rate sensitivity. Thus, the loyalty and depth of the relationship are inversely correlated to interest rate sensitivity. Customer retention matters not only for not losing a customer, but also for superior performance.
- Competition Matters: The more competition you have with higher rates than your bank’s, the more likely your sensitivity scores will trend. There is a reason why banks in Guam and Hawaii have some of the best deposit performance. Rural branches are good for lowering sensitivity, while urban branches are critical for raising balances.
- Branches and Bankers: The number and quality of your branches and bankers matter. Both are positively correlated with lower sensitivity performance. Of the two, the number and quality (experience) of your bankers not only have more of an impact on lower sensitivity but are also the least costly option.
- Data and Quantification: Without quantification, experienced bankers do an impressive job judging interest rate sensitivity. Bankers tend to price their deposits correctly in aggregate (about a +2 bps error), but they are usually 17 basis points off either higher or lower. This means that on their whole portfolio, bankers tend to only slightly overprice their portfolio but any given customer is likely an average of +- 17 basis points. Analyzing and quantifying your customers will reduce errors and give you faster feedback to make strategic and tactical changes.
Putting This Into Action
We are now on summer break for the 2025 F1 season. This is when every F1 racing team starts thinking about what they can change for the back half of the year. Similarly, bankers should start thinking about building a faster deposit car by adjusting rates, products, and tactics.
It takes everyone in the bank to build a fast deposit operation that can go 230 mph in the straights when no one changes rates, or in the curves where competition is trying to slow you down. Putting more resources into deposit building is one of the best investments a bank can make. Building a deposit-oriented bank is one of the most reliable paths to outstanding performance.
As the lead engineer in the F1: The Movie said, “Formula One [like banking] is a team sport. It always was.”