Predicting Community Bank Cost of Funds
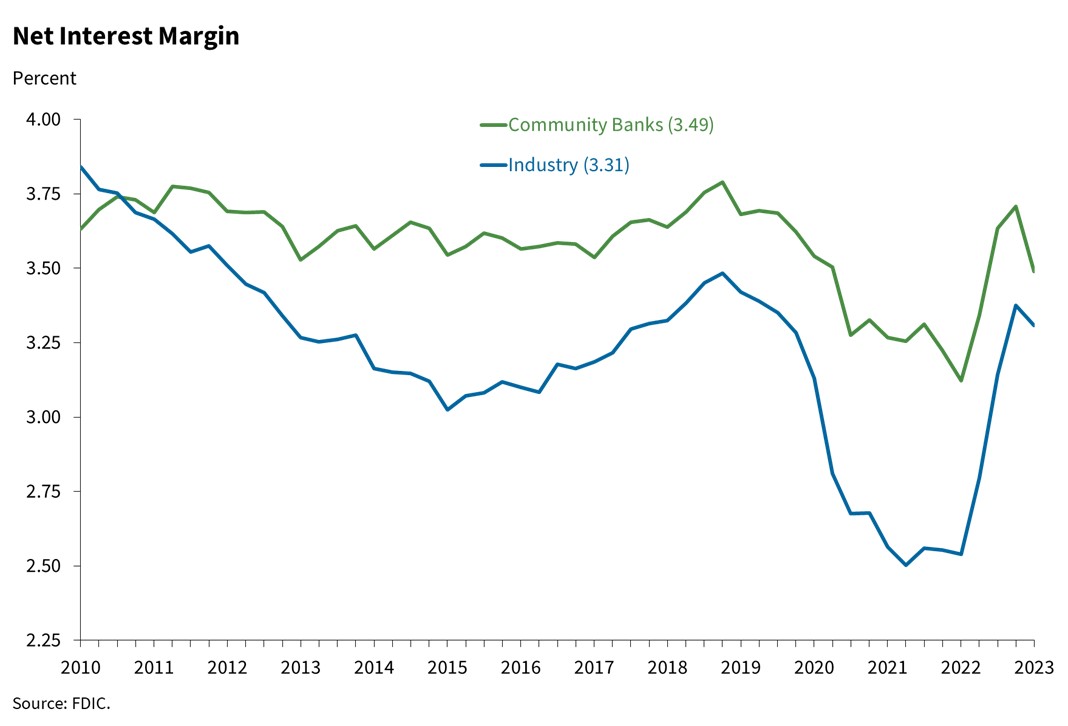
Community bank cost of funds is jumping up. As shown in the graph below, the net interest margin (NIM) for community banks declined 22bps in Q1’23. Most of that NIM erosion is the result of a sharply higher cost of funding earning assets (COF). The question is – what will happen to community bank’s cost of funds from here?
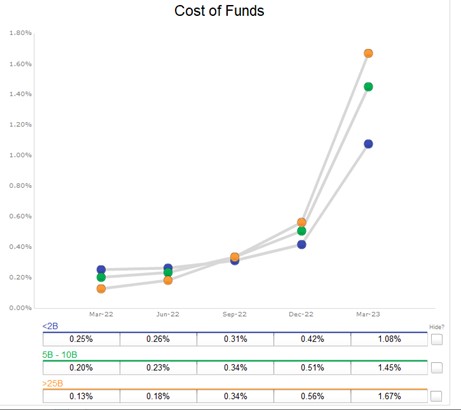
The graph below shows community bank cost of funds compared to those banks over $25B. Community banks’ COF increased 66bps in Q1/23 sequentially for banks below $2B in total assets and 94bps for banks between $5B and $10B. With the Federal Reserve expected to pause at its next meeting on June 14th (the probability of a pause is now 68% in the futures market), what will happen with NIM and COF for community banks? Unfortunately, community banks’ most formidable challenges in managing their cost of funds lie ahead, not behind.
Community Bank Cost of Funds and Federal Reserve Cycles
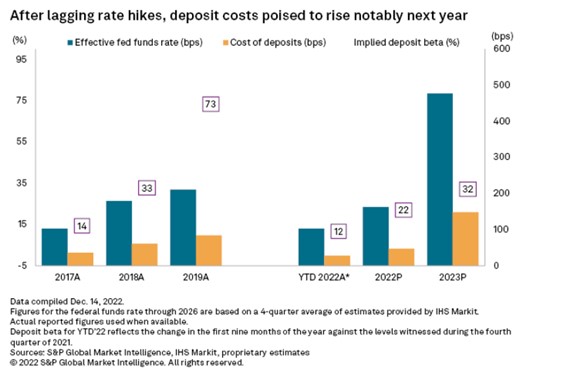
Historically, community bank cost of funds betas usually hit their highest point near the end of the rate-tightening cycles. This makes sense as COF lags behind Fed tightening, and deposit betas increase substantially as the Fed pauses and a bank’s cost of funds continues to grow. This can be seen in the graph below (from S&P Global) that shows annual deposit betas increased from 0.14 to 0.33 to 0.73 from 2017 to 2019, respectively. SP Global also forecasts deposit beta for the industry in 2023. However, we believe that industry deposit betas will be substantially higher in 2023.
The table below shows the last three Fed tightening cycles: Q3’99 to Q4’00, where the rates increased by 1.75%; Q3’04 to Q2’07, where rates increased by 4.25%; and Q1’16 to Q1’19 where rates increased by 2.25%. The beta for all banks and various sizes over the entire cycle is listed below.

There are a few key takeaways. The beta for larger banks is higher but moving closer to the industry average. The 2016 to 2019 hiking cycle is unusual in several ways: it is slow-paced, relatively shallow, and was conducted after massive quantitative easing without commensurate quantitative tightening.
There are two significant reasons why we believe that the industry’s deposit betas through 2023 and 2024 will be substantially higher than previously predicted.
- Online banks are major industry competitors that comprise about 11% of all deposits. Online banks like American Express, Capital One, Marcus (Goldman Sachs), Ally Bank, and others have much higher betas (American Express Bank at over 73%, and Marcus at 77%, as an example, in the last tightening cycle). We expect these institutions to increase the industry’s beta in this hiking cycle.
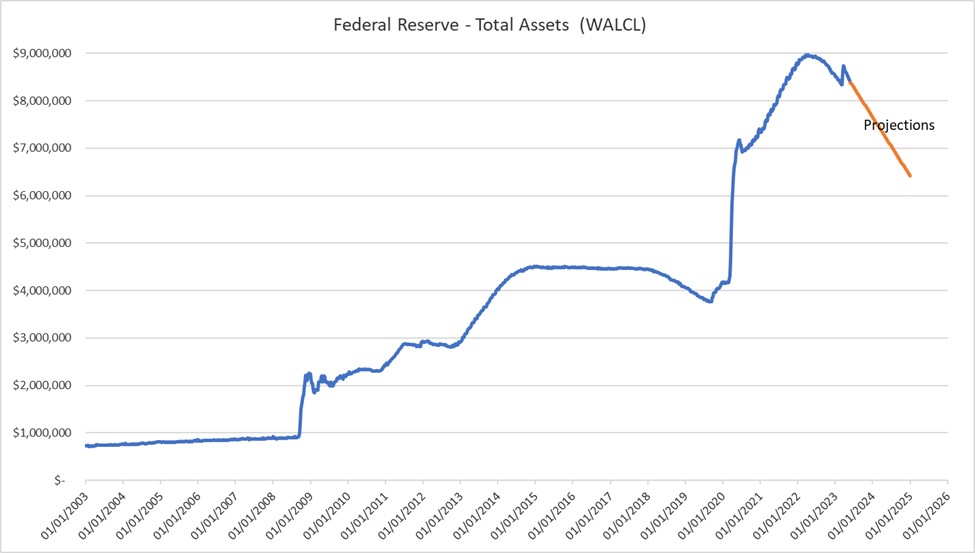
- The balance sheet tightening will continue at $95Bn/mo when the Fed pauses with interest rate hikes. This is in contrast to the 2016 tightening cycle when the Fed started draining its balance sheet two years after its first rate hike, the tightening was only $50Bn/mo, and the tightening was paused shortly after that. The tightening process in this cycle will be faster and larger than in the previous cycle and will cause industry COF to continue to increase for an extended period after the Fed pauses rate hikes. The graph below shows the Fed’s balance sheet and projections to 2025.
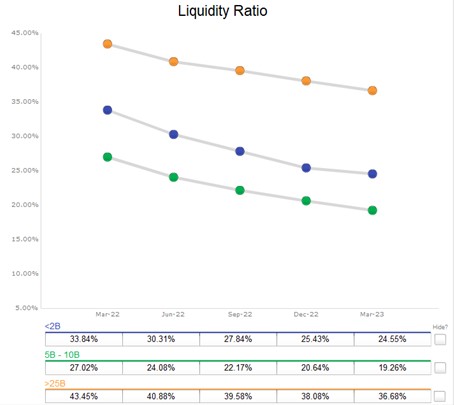
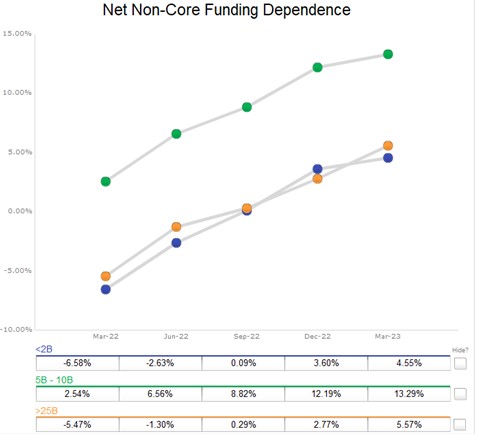
This quantitative tightening, largely on automatic pilot, is causing the M2 money supply to shrink for the first since the Fed has been keeping this data (1959). The decrease in the money supply will put continued pressure on banks’ liquidity ratios (already declining, as seen in the graph below), and increase dependence on non-core deposits (the second graph below shows current trends), resulting in increased COF as long as the Fed continued to drain its balance sheet.
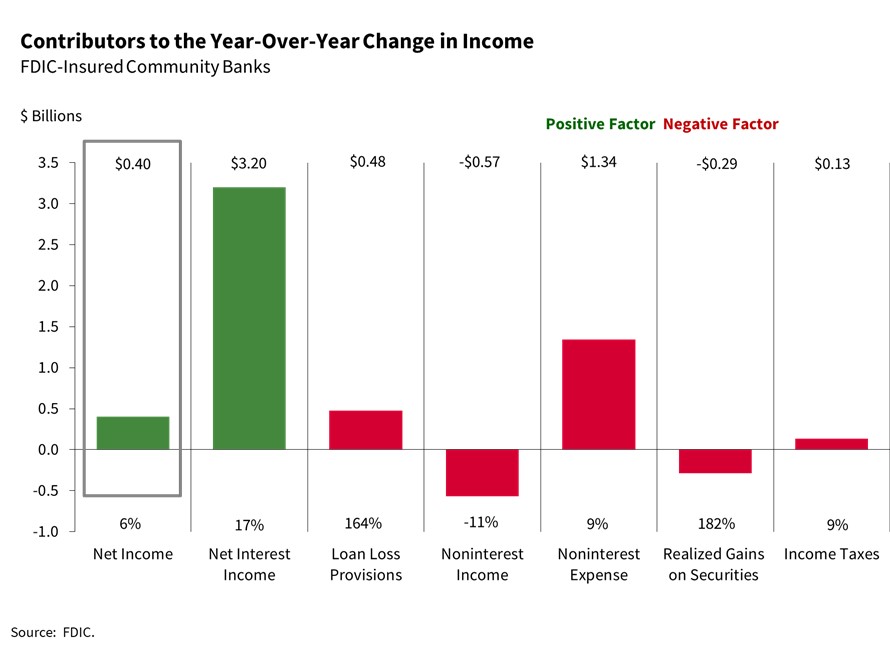
As long as the money supply declines (and quantitative tightening continues), banks will experience funding pressures – resulting in higher COF and asset runoff. The problem for community banks is that NIM has been a significant factor in income contribution (see graph below). When NIM contracts on existing portfolios of assets and liabilities, some banks’ business models will be strained.
Conclusion
Community banks can do much to design and execute deposit and asset pricing strategies properly. In an environment where interest rates are steady but COF continues to increase, community banks must find ways to preserve net income, especially fee income. Here is how we see successful community banks outperforming their peers:
- Increase the duration of client relationships. Longer relationships lead to more stable interest-bearing deposits and more non-interest-bearing deposits.
- Increase product engagement and duration. Community banks must connect their products to the client’s balance sheet instead of pieces of frequently bought and sold collateral.
- Prepayment protection on credit facilities can enhance client retention. All too often, banks negotiate this attribute away in the course of competing for and negotiating the loan.
- Owner-occupied CRE often affords banks non-interest-bearing or low-interest-bearing accounts. This client segment is highly sought after, partly for this reason. Furthermore, these commercial deposits have positive convexity – increasing balances in rising interest rate environments. In order to compete for this business, banks must be able to measure risk-adjusted return on equity on a relationship basis.
- Creating competitive products to cross-sell is key to retaining customers. Clients with more than three products at a bank are shown to be longer-term clients and are likelier to be less interest-rate-sensitive depositors. The cross-sell benefit for banks is not just additional revenue but additional stable deposits.
- Finally, all the above pieces are difficult to measure, analyze and assess. Management’s decision on pricing, strategy, and product offering becomes futile without a commercial loan pricing model that can capture the benefit of deposits, cross-sell opportunities, retention estimates, and lifetime measure of cash flow on an instrument and product level. High-performing banks implement robust pricing models to help them make decisions leading to lower community bank cost of funds, lower beta and enhanced overall deposit performance.

