Find Out Your Cost of Funds Correlation To Help Better Manage The Balance Sheet

Every year we analyze the industry’s cost of funding earning assets (COF) and track how community bank’s COF behaves relative to larger banks and how COF moves with various indices. The information is critical for all banks as it is helpful to understand how sensitive your balance sheet is to rising or falling rates. We also consider how banks can improve performance by controlling their COF and how funding costs will behave in the future based on market expectations.
Cost of Funds Analysis
We examined the existing 4,978 FDIC-insured commercial banks and S&L associations from 1984 to the present. We looked at quarterly COF for various bank asset sizes and considered COF relative to Prime and 1-month LIBOR. We also looked at the best fit for the lag between COF and these two indices.
As a side note, SOFR is only available from 2018 but is highly correlated to both LIBOR and to Prime (R2 of 0.97) so this data will apply as banks switch over to the new index in the next several months.
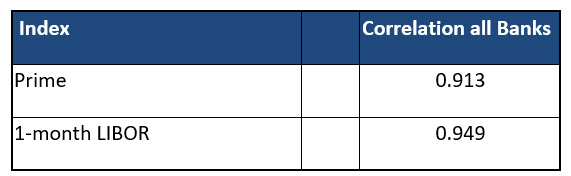
First, the correlation coefficient for Prime and 1-month LIBOR for the banking industry is high (between 0.91 and 0.96 R2 depending on asset size and lag for the index used). The correlation between all banks and Prime and LIBOR appears in the table below. The correlation between COF and 1-month LIBOR is a slightly better fit for all banks’ COF.
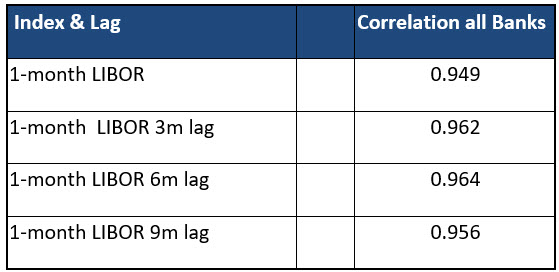
Second, we looked at the best fit for the lag between the indices and banks’ COF. Because the change in interest rates takes time to affect banks’ COF, we considered various time lags to determine the most correlative data series. It appears that it takes 6 months for changes in interest rates to translate fully on COF. We recognize that we measure correlation and not causation. There are many variables that we cannot control that will dictate the lag between interest rate changes and COF changes.
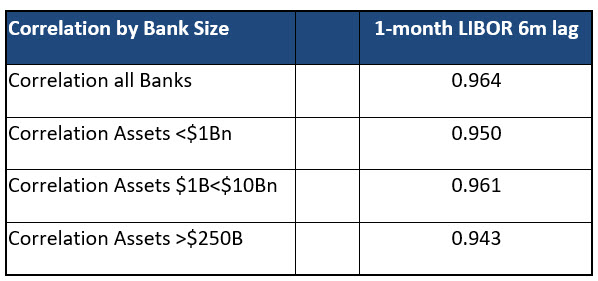
We then considered the correlation between COF and 1-month LIBOR for banks in various asset sizes. Smaller and larger-sized banks exhibit a very similar correlation between both indices and their COF. While this may appear odd at first because community banks do not typically price deposits to LIBOR or Prime, the results, nonetheless, are intuitive. Because larger banks do price their deposits to LIBOR and make extensive use of funds transfer pricing (FTP), and because the larger banks comprise such a dominant share of the deposit market, all banks in the country are simply following the general pricing set by the national banks. The top 10 largest banks in the country control more than half the deposits in the industry. We would posit that most banks over $50B in assets (which control the vast majority of deposits) are judiciously adhering to FTP. Therefore, the bank deposit market for small and large banks is strongly correlated to LIBOR and Prime.
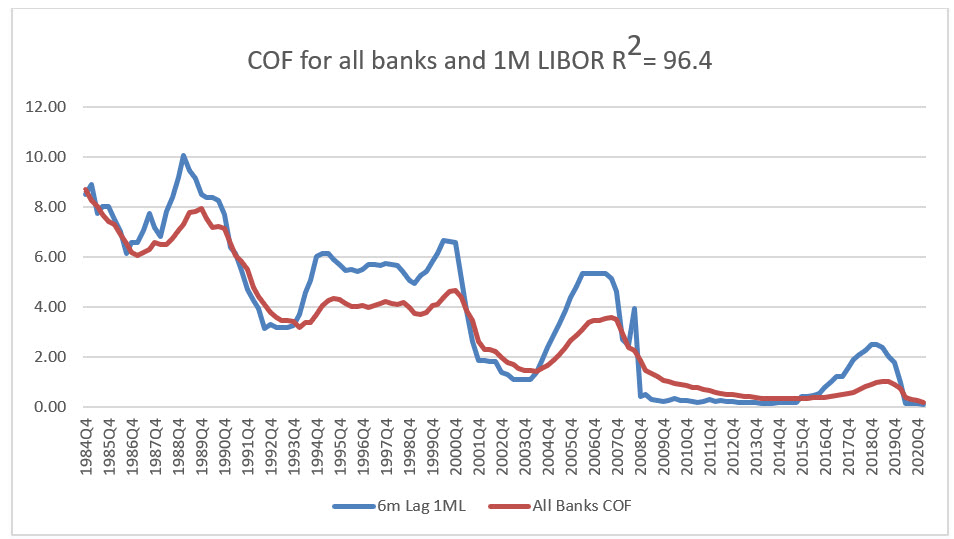
Graphically the average bank’s COF looks like the graph below compared to 1-month LIBOR with a 6-month lag. We can also run the analysis for individual banks in the country.
How to Apply to Your Bank
First, despite surprising some bankers, the COF for community banks is highly correlated to Prime and LIBOR even though community banks do not generally price their deposits expressly to either index. Second, the best-correlated index for community banks’ COF is 1-month LIBOR. Third, the best correlation lag-adjusted is 6 months. We believe that banks’ COF will continue to be highly correlated to short-term rates. Finally, SOFR is expected to become a dominant benchmark index that will replace LIBOR in the near future, and we believe that SOFR will demonstrate a high correlation to banks’ COF over time. Let us know if you would like us to run the COF graph for your bank by contacting us via email or website. Let us know, give us a couple of days, and we will provide you with the analysis for you to review.