How To Project Credit Quality In the Age of Covid-19
Community banks face a new and unfamiliar underwriting risk – an epidemiological disruption that has limited visibility and short history that affects both free cash flow and collateral values. In addition to debt yield, debt service coverage ratio, and property values, banks now need to understand how all of these credit parameters are going to change because of Covid-19. Lenders need to know how the virus is changing financial and business models on a sector and subsector level, and community banks need to overlay that understanding on a geographically granular level (county-by-county). Community banks should use a risk-adjusted return on capital (RAROC) loan pricing model that incorporates real-time data, analytics capabilities, and zip code level calculations to access credit risk and price their loans accordingly.
Damage to the Economy
The real GDP contracted 5% quarter-over-quarter (QoQ) in Q1/20 and then contracted another 33% QoQ in Q2/20. The lockdown also triggered massive unemployment. The current forecast is for GDP to continue to contract through Q1/21, and the Fed is estimating that pandemic-related loan losses for US banks will be north of $700B. Last week, several Fed officials signaled that the economic recovery might be losing steam. While the Fed has limited tools left to stimulate the economy, Congress has no theoretical cap to mitigating economic damage. Still, practically, political will and staggering public debt levels are nearing a tipping point. Banks are lending and will continue to do so, but how should community banks decide where to deploy capital and how to price that capital?
More Attention to Real-time Data
In a slowly changing world, reliance on quarterly and monthly backward-looking data was sufficient to allow managers and analytical models to predict future probabilities of default and loss-given-defaults. However, with daily and weekly changes in the effect of Covid-19, resulting in equally rapid changes in financial conditions, lenders need to look at more real-time data. Instead of looking at GDP, consumer spending, and unemployment rates, which are one to five-month stale upon publication, banks need to reconfigure their underwriting to high-frequency analytics. High-frequency analytics is real-time data and includes the following: point-of-sale transactions, credit-line utilization, current-account inflows, and foot traffic maps (such as Google).
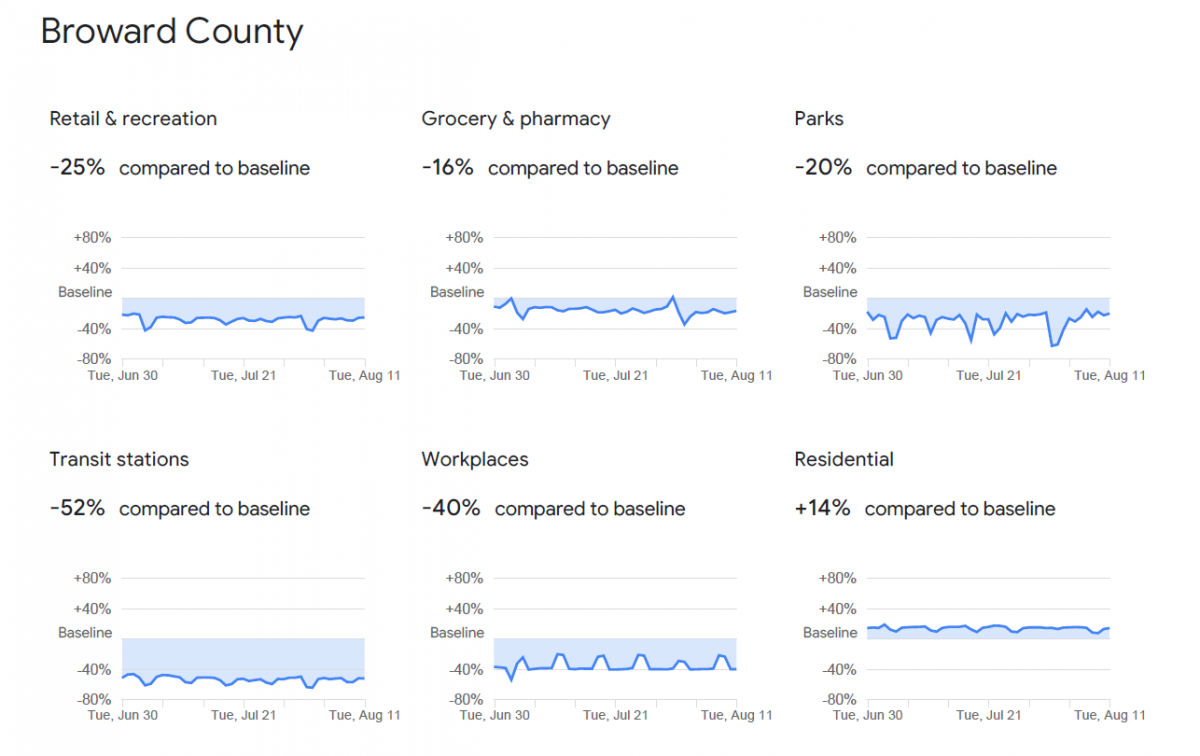
As an example, GDP numbers come out quarterly and are released approximately two months after each quarter. That information is historical and almost useless for a rapidly changing underwriting environment. On the other hand, Google community mobility reports are nearly live and provide information down to the county level and measure percent change in visits to grocery stores, or restaurants, or theme parks. This real-time information is much more actionable for community banks looking to lend their capital to small businesses in their community. Below is an example of a Covid-19 community mobility report for Broward County in Florida. Every community bank should be tracking this information for its lending regions and incorporating this analysis in its RAROC modeling and loan pricing. Our loan pricing model has the ability to include such granular information.
Predictive Analytics
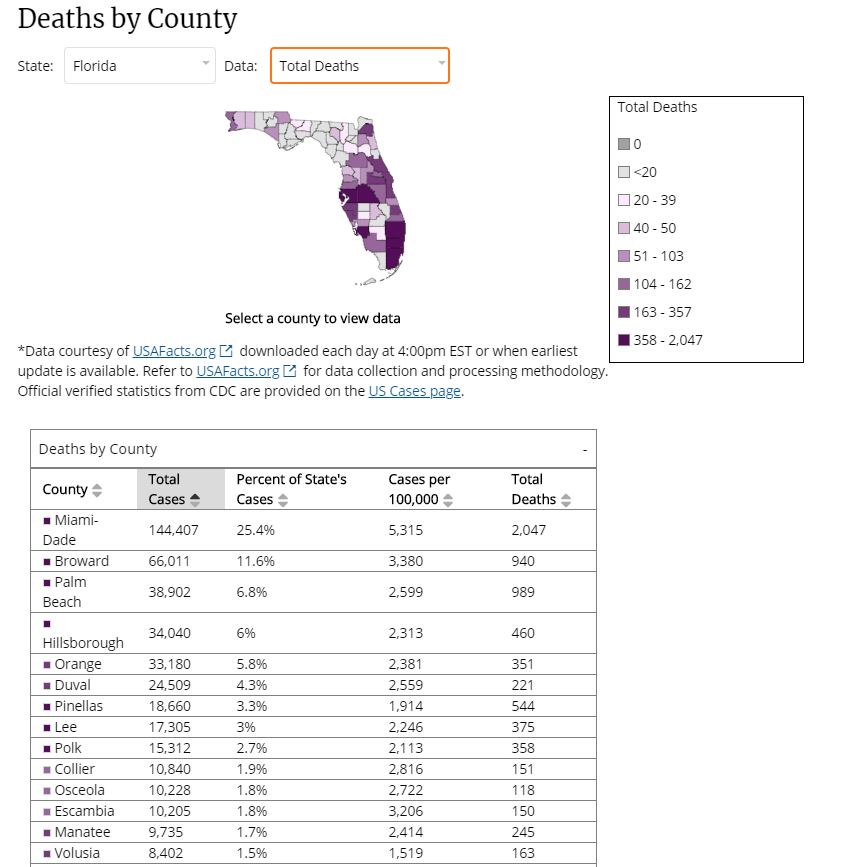
Community banks should have loan pricing tools that take into account the current stress on obligors’ cash flow and collateral values. However, banks also need to assess credit quality in the future. A full economic recovery will remain elusive as long as the virus posses significant threats to public health and limits consumers’ willingness and ability to spend money. However, assessing the future path of the virus is difficult. It will depend on the efforts by states to control the virus, the public health guidance, and the length of the economic downturn (the longer the economy falters, the more difficult it will become to recover). The CDC reports county-level Covid-19 information, as shown in the graph below.
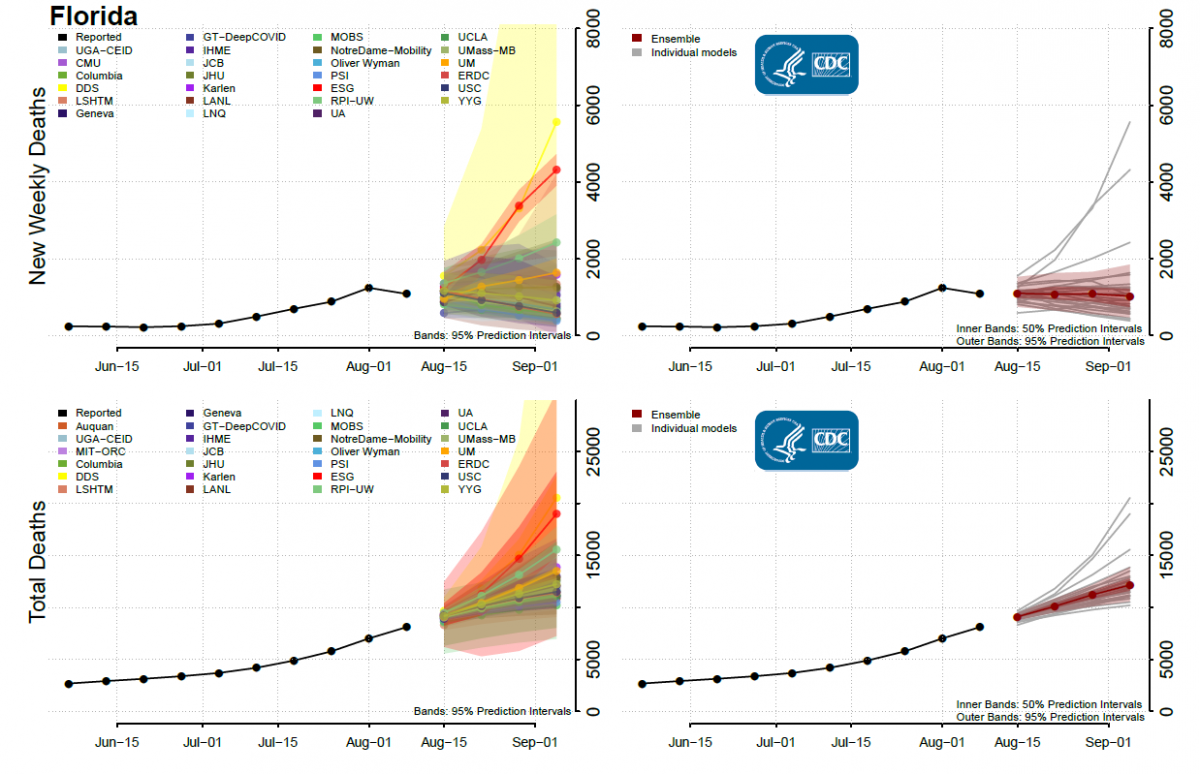
The CDC also publishes forecasts of national and state-level Covid-19 over four weeks derived from 31 modeling groups. These state-level forecasts predict the number of deaths and new cases, and the CDC graphs the cumulative average of all 31 models and 50% and 95% prediction intervals. This is a powerful way for banks to consider the impact of the virus on borrowers in the near future. An example of the graphs for the state of Florida appears below.
Sector and Subsector
Aside from specific obligor credit risk problems that require real-time monitoring and forecasting, banks must develop sector and sub-sector analysis for Covid19 risk. In a rapid crisis, as the case today, banks must be quick to identify which industries and sectors will struggle and which will be little affected. One bank has developed a matrix that incorporates demand shock and recovery time for different sectors. That bank’s graph appears below.
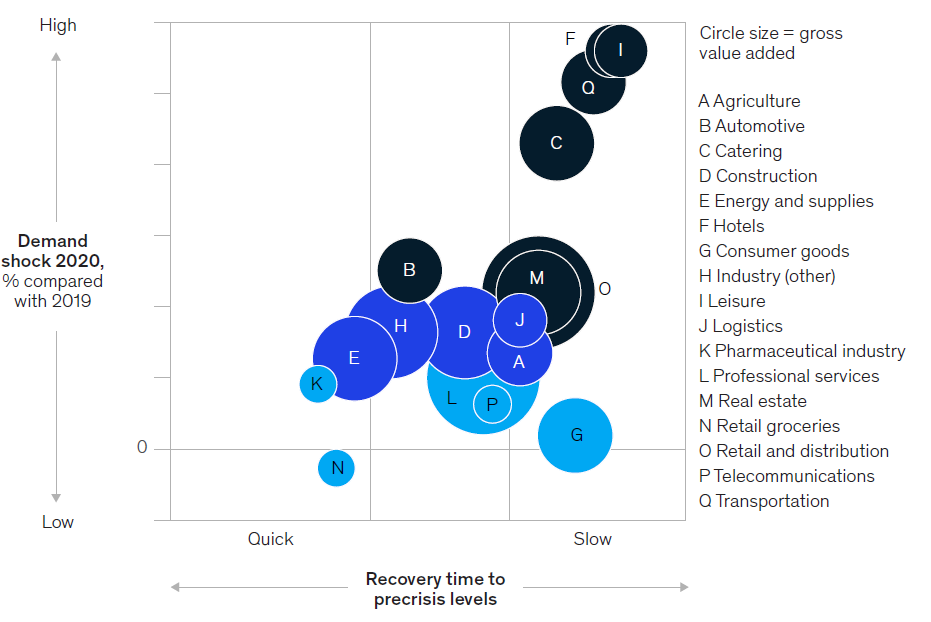
This type of Covid-19 sector and subsector analysis is a crucial way to manage credit risk, but bankers understand that business models within the same industry can be very different. Some businesses have a robust online presence, for example, while other companies in the same industry do not. The recovery trajectory of each industry and subsector will depend on the dimensions of the virus and its impact on the recession in each state.
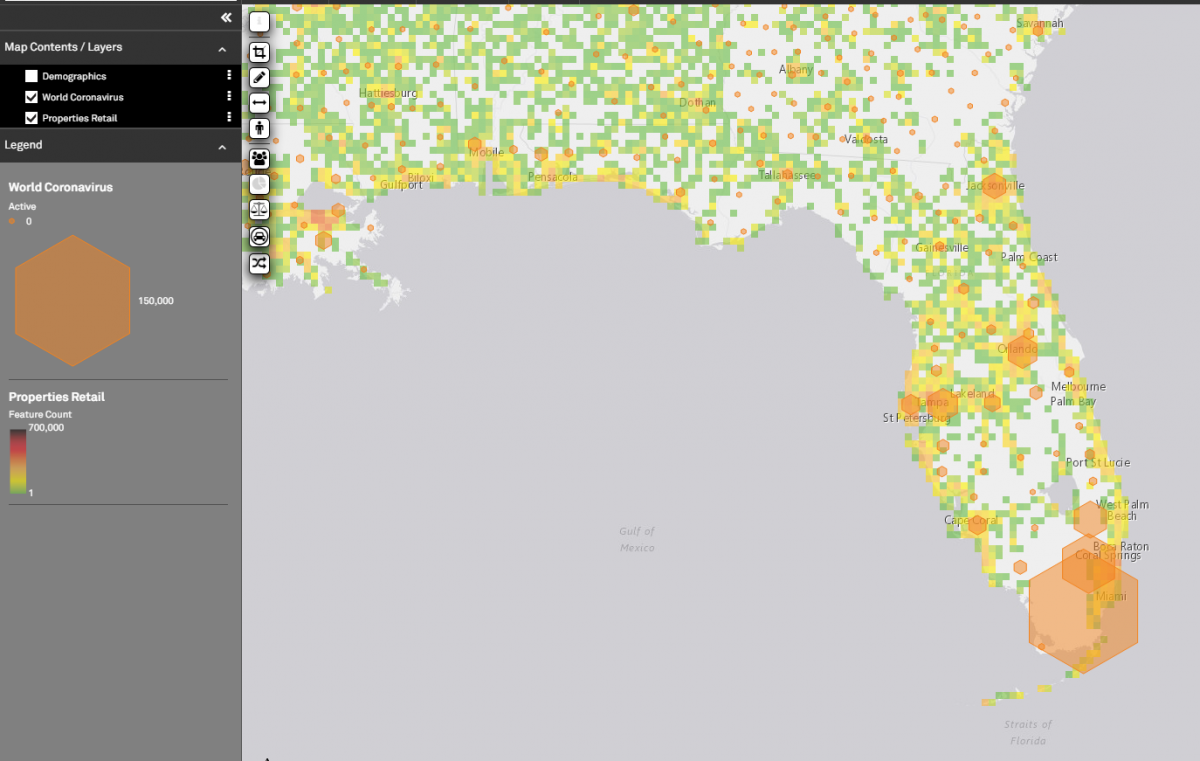
In underwriting decisions, community banks must have the ability to overlay sector-specific data with Covid-19 developments. For example, the graph below shows retail properties in Florida and active Covid-19 cases. In this database, we have the ability to identify each retail location, including our borrower’s, to assess the possible impact of Covid-19 on cash flow and recovery times.
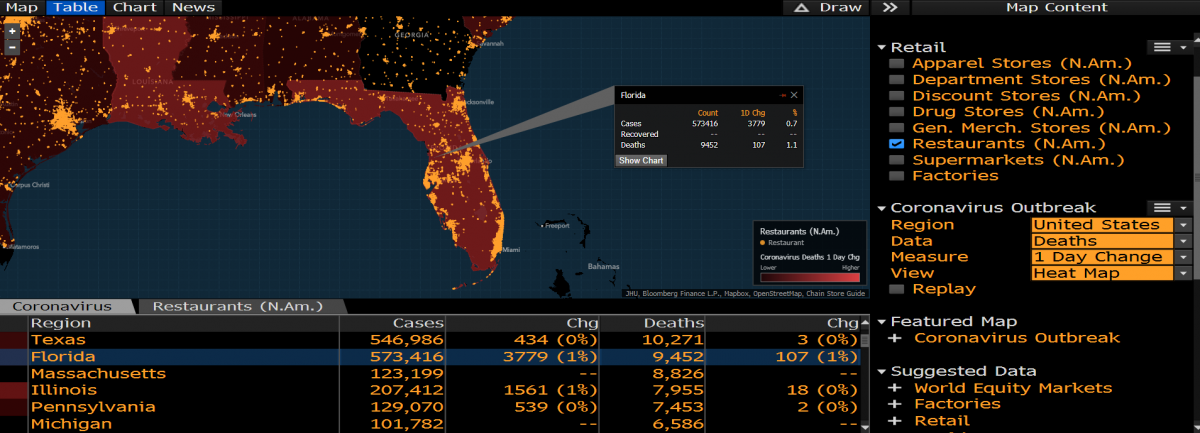
We can also identify subsector retail locations, such as restaurants, as shown below for Florida, to assess if our borrower’s specific location is optimal for on-premise dining.
Caveat
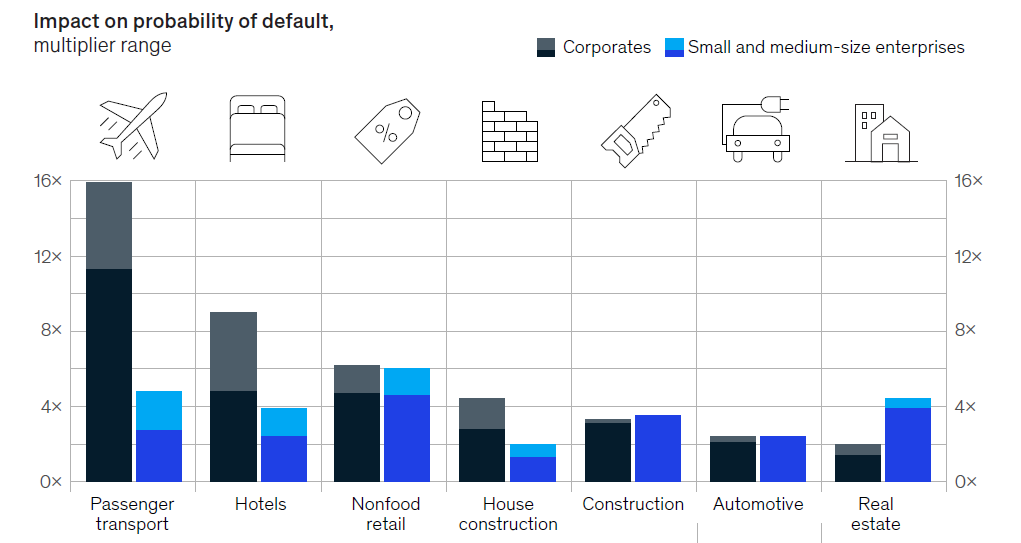
Bankers also must understand that the Fed and Congress have intervened in very significant ways to support businesses and consumers. If these policies expire or are diminished, then the full credit impact on lenders will be dire. This policy risk is yet another unknown for community bankers. Assuming that federal and state policies continue, RAROC models still show that the probability of default shocks can be an average of two to four times larger during this recession. Below is an example from a consulting company of forecasted probability of default shock for various industries during the pandemic. Our loan pricing model has the ability to incorporate such predictive credit shocks.
Key Takeaway
Every community bank should have access to a RAROC model that takes into account how Covid19 will impact a specific borrower’s probability of default and loss-given-default. Bankers must understand how the pandemic may impact that specific borrower’s operation, sector, and subsector, base on the geographic location. With so much uncertainty around credit risk, a bank can save itself from disaster by having the proper analytical tools and paying attention to how Covid19 interplays with credit risk.

