How Your Bank’s Portfolio Could Look a Year From Now

Last week we took a look at why and how bankers must triage their credit portfolio first before taking action. We also looked at some initial restructuring steps banks can take in a related article. In today’s article, we model a $1B commercial loan portfolio and look at what could happen to probabilities of defaults, loss given defaults, and losses in 2020 on an adverse case basis. Before you triage your commercial loans according to size, consider prioritizing them according to risk. The output contained here can help inform bankers what to expect and help them allocate resources accordingly.
The Model Portfolio & Methodology
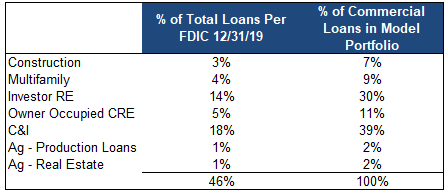
For illustrative purposes only (banks need to do their own analysis), we created a $1B commercial portfolio with the mix in-line with a bank’s current holdings of commercial credit as of the end of 2019. We then modeled an adverse forecast that is akin to the severely adverse scenario under the Fed’s comprehensive capital analysis and review (CCAR). We increased the deacceleration of the economy by a factor of three and modeled a slower supply-side shock in addition to the demand side shock.
For the sake of COVID-19 infection modeling, we used the same assumptions as our previous analysis and modeled the Italian path, with a nationwide shelter-in-place order by April, a relaxing in June and then a spike in infections during the fall of 2020. We assumed a 60% infection rate, a 0.88% case fatality rate (running 1.2% now), therapeutics, and serological tests (to test for immunities) by June and a vaccine by 2021.
Here we see unemployment jump to 6% in April and 12% by June before ramping down to stabilize back at 5.5% in 2022. We start GDP at -1.0% at the end of March and drop it to -14.0% at the end of June to return to a 5% annualized rate late 2021 as the economy snaps back. Retail sales, another major component to our model we start with a slight acceleration by the end of March to $532B (as purchases such as food items were pulled forward) dropping to $350B in June before increasing.
The other piece of the model that is new is a set of forbearance assumptions. Here we assumed that forbearance was available to any commercial borrower that could show impact and that there was no documentation needed (other than the application) to prove hardship. We assumed an average forbearance term of four months and a maximum of six months starting in April. While we assumed that the forbearance would not impact the credit profile of the borrower, in and of itself (and thus would not hinder the extension of future credit or relief), we did assume that a business’s fixed-cost structure would remain as would 40% of their variable costs. As such, the probability of default increases during the forbearance period.
Investor Commercial Real Estate Impact
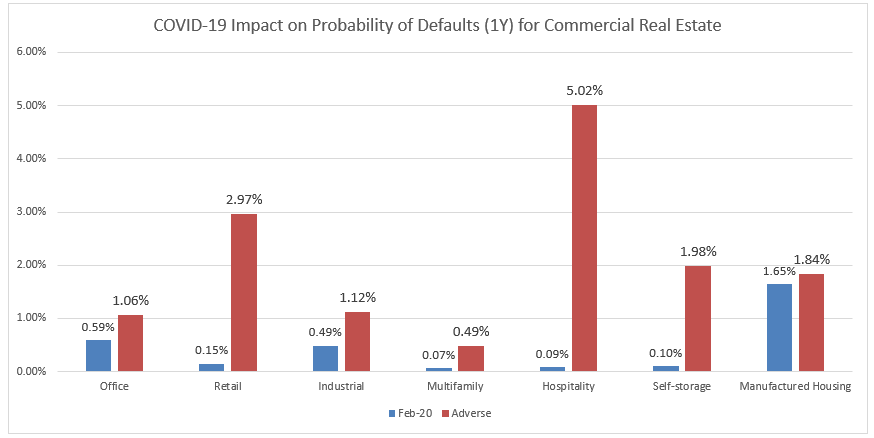
As previously discussed, hospitality, restaurants, bars, gaming, and retail, commercial real estate remain the most at risk. Here, we modeled property level cash flows being down 40% to 80% with a mean of 62%.
To a lesser extent, we see a negative impact on office and multifamily, in-line with a general economic downturn and unemployment. We also see a slight increase in office risk going forward as work-from-home gets more normalized.
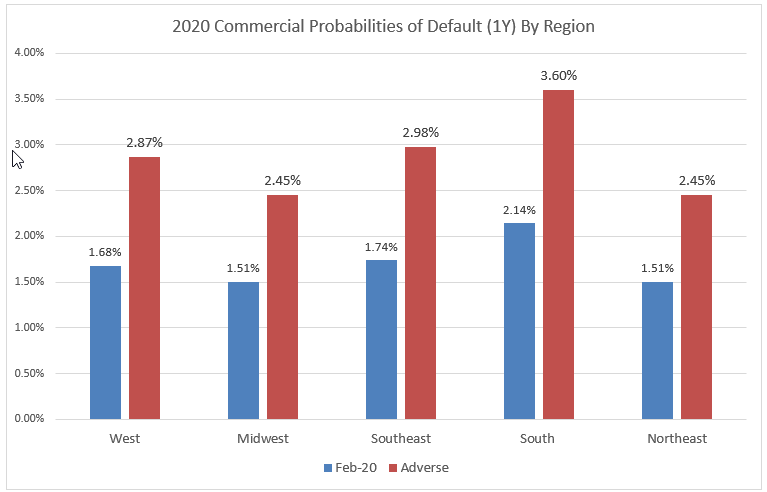
From a geographic basis, we have most of the impact starting on the West Coast in March, going to the Eastern Seaboard in April and then hitting the Midwest. The exception is the Southwest and, to a lesser extent, the Southeast that has the added energy shock as well, which we assume hit immediately in March. We see the full impact on probabilities of default and loss given default peaking with the June data. As such, below are our 2020 projections.
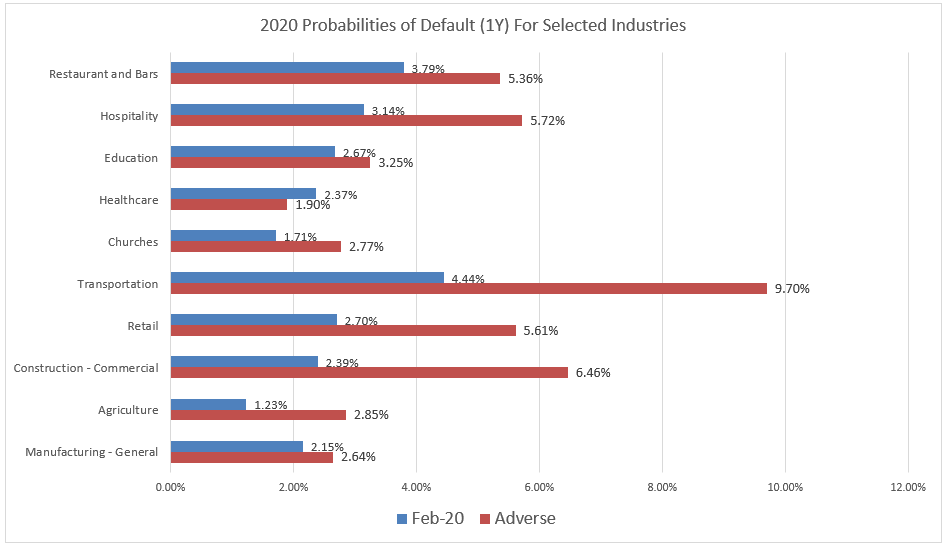
C&I and Owner-Occupied Commercial Real Estate
We covered most of these industries before but continue to add to our “Watch List” as the stresses become evident. Below are specific updated probabilities of default for higher-risk sectors.
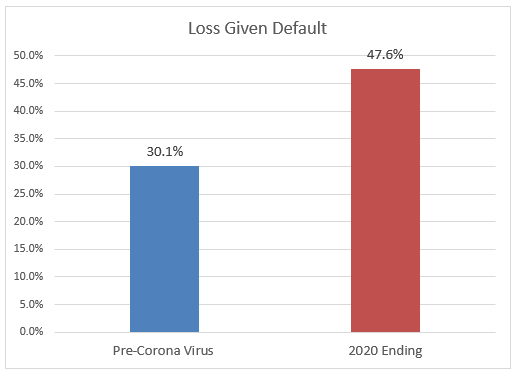
Loss Given Default
After probabilities of default, we aggregate loss given default and note that due to falling property and going concern valuations, plus the additional cost working with each borrower to try to understand their unique situation, the cost of managing each special asset increases. During the recession, understanding a business’s failings was not only more straight forward, but we had a large amount of data on curing defaults to make a credit determination. Now, we are in uncharted territory, and it is safe to say that no credit model on pandemic default cure periods currently exists. As such, more time will be spent trying to figure out the nuances of the credit. This will result in a higher workout costs than we have experienced before.
The net result is that loss given default is currently predicted to go from 30.1% to 47.6%.
Putting This All Together
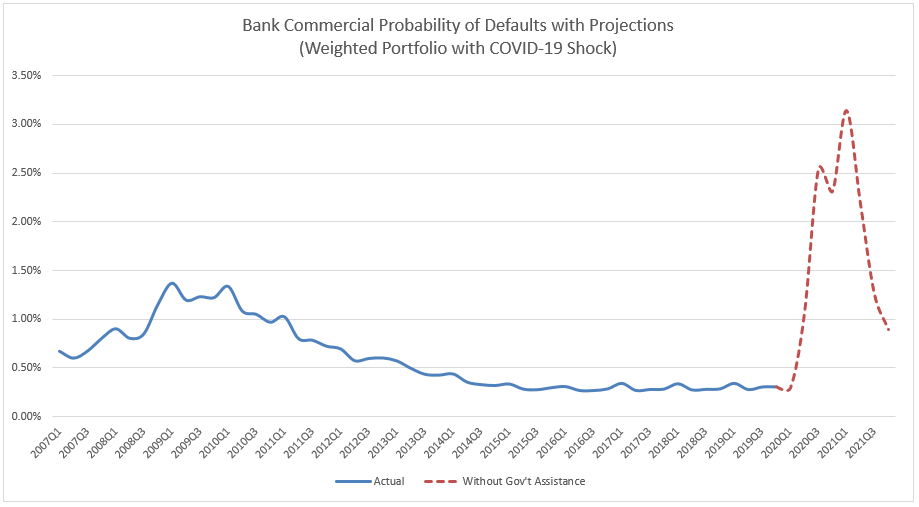
From a time series perspective, you can see the net result of the weighted commercial loan portfolio below. From near-record lows, we are about to go to record highs far exceeding the 9/11 shock and the Great Recession of 2008.
Our projections show a second-quarter 2020 spike and then another jump up in 3Q from the combination of an increase in the infection transmission rate and the exhaustion of cash flow at the business level.
If you take the above weighted average probability of defaults multiplied by the current exposure at default times the loss given default, you get expected losses of approximately 1.49% (keep in mind that this is after a forbearance period). For a billion-dollar commercial credit portfolio, that is $14.9mm of losses, or $10.1B of commercial losses for the industry. Current commercial reserves are running at 0.92%, which means that each bank will have to allocate an additional $857,102 of capital to losses, or $3.8B for the industry.
Of course, this is only an estimate, just for a commercial portfolio, and computed for an aggregate bank. If you have more than 3% of your credits in construction or larger than average holdings of hospitality, retail, or restaurant or other high-risk sectors, then your losses could far exceed the average. This is also an adverse case and not a severely adverse case, which starts with a 25% level of unemployment through 2021.
While our assumptions might be off and this may not pertain to your bank, at least this gives you a starting place to begin to allocate your time according to the largest risk, instead of the largest credits. Further, this can serve as a base case in the coming days, and we will start to understand the various government programs and then start to apply it to this base case to see where it can help.
In the meantime, banks need to figure out ways to streamline the forbearance process while working on a framework for figuring out which credits to save and which credits to move to foreclosure. The important part here is that banks need to stop thinking this is a short-term shock, and we are going to get back to normal anytime soon. We might, and we might not.
The major problem is that we just don’t know and until we find therapeutics to slow the spread and lessens the impact of the disease. We won’t be able to dampen volatility until we find a serological test to determine if someone has immunity or not. Until we do both of those things, we will live in a downwardly spiraling world. While health professionals work on the COVID-19 challenges, we all need to work on the economic problems to figure out how to slow the impact while trying to figure out which of our borrowers are immune.