
Managing Commercial Lender’s Portfolio Profitability

Most community bankers manage their lenders by loan volume, loan count and credit quality. Few community banks look at the client level contribution to overhead or the risk-adjusted return on capital (RAROC) for each lender’s portfolio profitability . We analyzed one lender’s portfolio of 146 relationships, and a very uneven picture emerged. This picture is almost always the same and it is rarely what managers expect.
We plotted the portfolio of a single commercial lender where each dot on the chart represents one client relationship, ranked from most to least profitable. Profitability is measured as contribution to overhead: total revenue from the relationship minus the cost of funds. What the chart shows is not a portfolio of 146 similar clients, but instead a handful of relationships carrying the book, a large middle that barely covers its costs with a negative ROE, and a tail that the bank is effectively subsidizing.
This article explains lenders portfolio profitability, then answers three practical questions: how does this lender keep his best clients, what makes a relationship profitable in the first place, and what can he do to raise portfolio profitability when competitors will not let him win on price?
Reading The Distribution
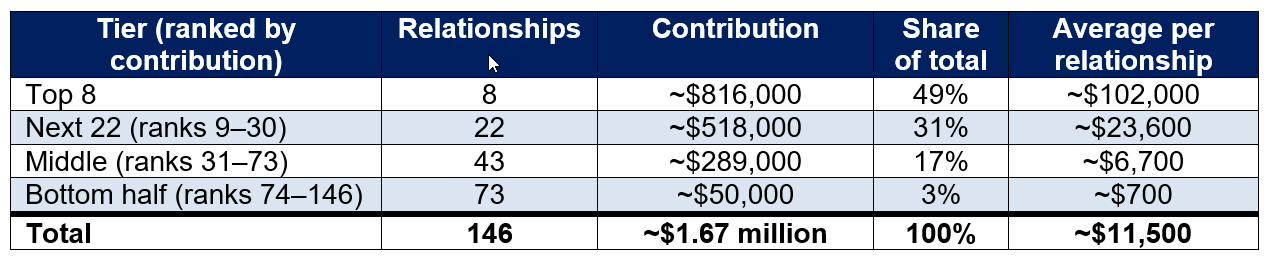
The lender manages 146 relationships that together contribute about $1.67 million to overhead over twelve months. That works out to an average of roughly $11,500 per relationship. The average, however, describes almost no one in the book. The median relationship contributes only about $2,800, less than a quarter of the average, because a few large contributors pull the mean upward.
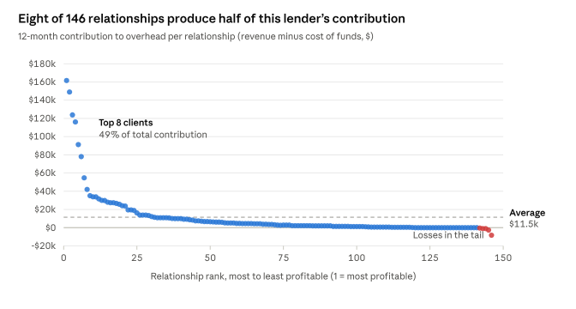
The concentration is striking in that the top relationship alone contributes about $162,000, nearly 10% of the portfolio’s total. The top eight clients, just 5% of the book, produce about $816,000, or roughly half of all contribution. The top 30 clients, about 20% of the book, produce 80% – a textbook Pareto curve.
The bottom of the curve deserves as much attention as the top. About 44 relationships contribute less than $1,000 each, and roughly 27 sit at or below breakeven. Five are clearly negative, with the worst losing about $8,000 a year. Once operating costs, credit provisions and capital are layered on top of contribution to overhead, most of the bottom half is certainly destroying value rather than creating it.
One more number is important to understand – our research suggests a commercial lender can effectively manage 40 to 60 relationships (not accounts, but true relationships). This lender carries 146, three times that load, and half of them produce 3% of his commercial loan profitability contribution.
Protect The Top Eight: Payoffs Are The Biggest Risk
When half of a lender’s commercial loan profitability contribution sits in eight relationships, a single payoff can erase years of new business. If the top client refinances elsewhere, the lender loses about $162,000 of annual contribution. Replacing it with clients from the middle of the curve would take roughly 24 new relationships averaging $6,700 each, and each one carries an acquisition cost of $6,000 to $10,000.
Our work on loan payoffs shows why this risk is rising. Borrowers prepay when a competitor offers a lower rate or looser structure, when they sell the property or business, when a project naturally terms out, when their credit improves, and when weak prepayment provisions hand them a free option to leave. That last factor is decisive because the same 10-year fixed-rate loan has an expected life of under three years with no prepayment penalty, but 7.8 years with a 5% provision for the full term.
For this lender, retaining the top of the curve means:
- Review every top 30 relationship for prepayment exposure. Loans without yield maintenance or step-down penalties (5-4-3-2-1) should be restructured at the next renewal or advance, not at maturity.
- Offer long fixed-rate certainty through a hedge program. Borrowers value 7-, 10- and 20-year fixed rates. A bank that provides them while keeping a floating yield wins durable assets that competitors offering five-year balloons cannot dislodge.
- Use assumability and collateral substitution clauses where possible. These keep the asset on the books when a client sells a property or buys a new one.
- Anticipate liquidity events. A lender who knows a top client is planning a sale can offer acquisition financing or deposit and wealth solutions before the proceeds walk out the door.
- Free up time for the clients who matter. At 146 accounts, the lender cannot call on his top clients often enough to see a refinancing threat coming or attempt to cross-sell and upsell to broaden relationships. The payoff research describes a self-reinforcing loop: overloaded lenders create transactional clients, and transactional clients shop every maturity and run off faster.
What Separates The Top of The Portfolio Profitability Curve From The Bottom?
This lender’s curve is not unusual. We have analyzed hundreds of thousands of commercial relationships at various banks, and the distributions have remarkably similar shapes: a small group of highly profitable clients, a long flat middle, and a tail of unprofitable ones. We have seen that shape at every bank we have reviewed, across different business cycles.
Our analysis shows why the shape occurs. Profitability tracks the breadth of the relationship far more than the loan itself:
- More products mean more profit per relationship. Credit products alone suffer from thin, competitive margins, earnings that swing with rates, and a high incidence of negative profit from credit and rate risk.
- Loans plus operating deposits are the foundation. Clients with both of these products consistently outperform loan-only or deposit-only relationships, because deposits lower funding costs even when loan spreads compress.
- Treasury management and merchant services add high-margin, recurring fees that scale with client activity.
- Hedging creates upfront fee income, reduces credit and rate risk, and increases stickiness. Loans, hedges and deposits together are a winning formula at many commercial banks.
- Wealth and investment services appear in fewer relationships, but those clients rank among the most profitable because they signal true primary-bank status.
- Industry matters far less than client size and product count.
The practical lesson for this lender is that his bottom half is probably not a collection of bad clients. Most of the unprofitable accounts are incomplete relationships: loan-only, no treasury services, no operating deposits and no fee products. His first job is to profile the top eight and the bottom 73 side by side and identify which products the top has that the bottom lacks.
Raising Portfolio Profitability When Price Is Off The Table
The instinctive fix for an unprofitable account is to raise credit spreads. In a competitive market, that rarely works. Our analysis shows that banks can maximize their RAROC without pulling on the credit spread lever through cross-sell, upsell, and correct structure. In a recent RAROC case, a community bank tried to win a relationship priced by the incumbent at SOFR + 1.25% while enforcing a 2.40% minimum spread. Raising the spread on a typical $350,000, 36-month loan with no prepayment protection, fees or deposits only moved economic ROE from -8.0% to about breakeven. Therefore, price alone could not fix a weak structure.
The same case showed how the other levers, applied in sequence at the original 1.25% spread, took the relationship from -8.0% to 15.8% economic ROE:
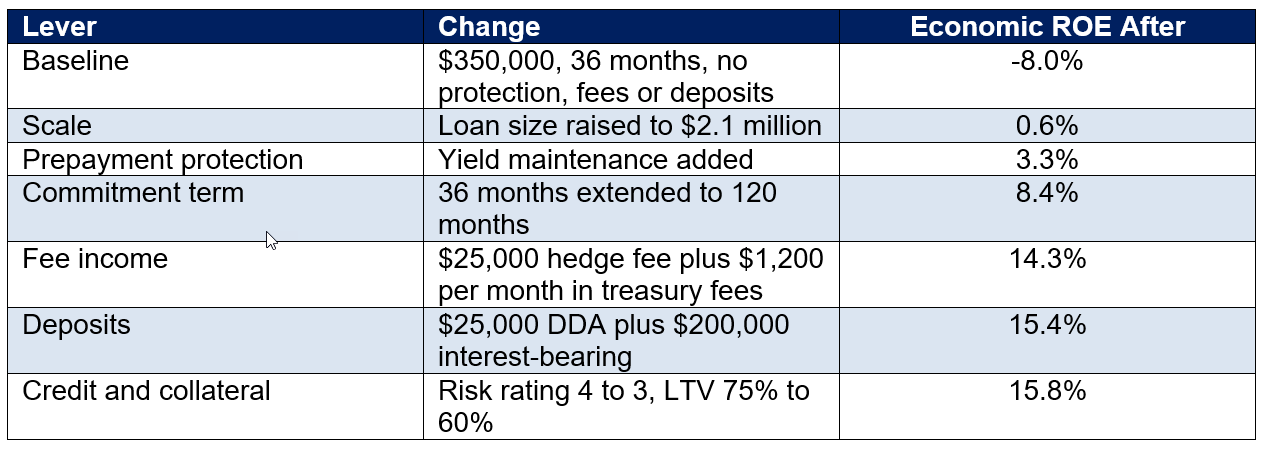
Applied to this lender’s curve, the levers suggest a clear plan:
- Upsell the middle. The 43 relationships in ranks 31–73 average about $6,700 contribution to overhead. Right-sizing facilities to each client’s full borrowing need spreads fixed costs over a larger balance, which was the single biggest early gain for most accounts.
- Lengthen and protect every new or renewing loan. Longer commitments with yield maintenance quadrupled the expected life of the revenue stream in the case, from 21–28 months to 77 months.
- Lead with treasury management and hedging. Fee income produced the largest single step-up in ROE and requires little incremental capital.
- Make deposits a condition of favorable credit terms. Operating deposits are what make a competitive spread affordable.
- Resolve the tail. For the 27 relationships at or below breakeven, offer the full relationship. Clients who decline should be repriced or allowed to leave, freeing capacity for the clients who matter.
From 146 Accounts to a Portfolio of Relationships
Most lenders’ problem is not a lack of clients. It is too many incomplete ones and too little protection around the few accounts that make up the bulk of the profits. Eight relationships produce half of the contribution, while 73 produce 3%, and all 146 compete for the same limited calling time.
The path forward follows directly from the chart. First, lock in the top of the curve with prepayment protection, longer hedged terms and deeper engagement. Second, profile what the top clients buy and sell it to the middle. Third, rebuild the tail through the full set of relationship levers, or release it. Community banks that measure profitability by relationship, reward lenders for it, and staff to the 40 to 60 relationship standard will see their curves flatten upward over time. The question for every lender is not how many clients, but how many of them are truly operationally relevant.