
Why Loan Payoffs Are Quietly Draining Bank Earnings

Across second-quarter 2026 earnings calls, one theme stood out: banks are originating loans at a healthy clip, yet balance sheets are barely growing because loan payoffs are running just as fast. S&P Global Market Intelligence reported that banks attributed the elevated payoffs to refinancing, asset and collateral sales driven by borrower liquidity events, normal project cycles in construction and multifamily lending, and deliberate credit cleanup. As an example, Flagstar booked $1.1 billion of CRE payoffs in a single quarter. FB Financial’s Nashville market had one of its largest production quarters ever – and ended the quarter flat, with hundreds of millions of dollars of production consumed by payoffs. Southside Bancshares saw payoffs jump from $113 million to $297 million quarter-over-quarter, and its CEO warned that Q2 “may not be a peak.”
Loan Payoffs take two forms, and both are important. Whole payoffs occur when a borrower refinances elsewhere, sells the collateral, or is intentionally exited by the bank. Partial prepayments include curtailments, excess amortization, construction loans that term out with another lender, and lines that pay down. These partial prepayments are ongoing and harder to detect, but their effect on the balance sheet and income statement can be just as significant. Together, whole, and partial payoffs are major determinants of a portfolio’s expected average life. That expected life, more than almost any other variable bankers track, drives profitability.
Loan Payoffs – Why Borrowers Pay Off Early
Loan payoffs occur for predictable reasons: (1) refinancing when a competitor offers a lower rate or looser structure – Columbia Banking System said some Q2 payoffs came from refinancing terms it would not match; (2) property or business sales, often triggered by liquidity events; (3) natural project cycles, such as construction and stabilization loans are designed to term out; (4) credit migration that includes improving borrowers refinance to cheaper credit (there are ways to avoid this type of payoff, which we will discuss in future articles) and banks pushing out deteriorating ones; and (5) weak or absent prepayment provisions, which hand the borrower a free option to refinance the moment rates or spreads move. Prepayment modeling shows how powerful that last factor is: the same 10-year fixed-rate loan has an expected life of less than 3 years with no prepayment penalty, but 7.8 years with a 5% prepayment provision for the full term.
The Earnings Impact: Two Identical Banks, Very Different Outcomes
Consider two community banks, each holding a $1 billion commercial portfolio with identical credit quality, funding costs, and overhead. The only difference: Bank A’s portfolio has an expected average life of 7 years; Bank B’s is 1.9 years (Bank B’s portfolio is not unrealistic but requires that lenders replace almost half the loan outstandings every year). Both target 5% annual loan growth, of which roughly 2% comes organically from market (GDP) growth – the rest must be acquired from competitors.
Bank A loses about 3% of its book to runoff each year ($30 million this includes prepays and slower initial amortization of its loan portfolio). To grow 5%, it must book $80 million of new loans. With an average loan size of $350–450 thousand (call it $400 thousand), that is roughly 200 new loans. At a fully loaded acquisition cost of $6–10 thousand per loan (business development, underwriting, appraisal review, documentation, booking – assume $8 thousand), Bank A spends about $1.6 million a year, or 16 basis points of assets, acquiring loans.
A 1.9-year expected life means roughly 50% of the book turns over each year. We calculate that Bank B loses about $526 million annually and must book roughly $576 million – about 1,440 new loans to hit the same 5% growth. Its annual acquisition cost is roughly $11.5 million, or 115 basis points of assets: more than seven times Bank A’s burden. Worse, nearly all that production must be pried away from incumbent lenders, which in practice means winning on price or structure. Its margin is thinner on a much larger share of the book and is the dynamic Coalition Greenwich flagged in the Southeast, where spreads fell below the national average as banks conceded on price under competitive pressure.
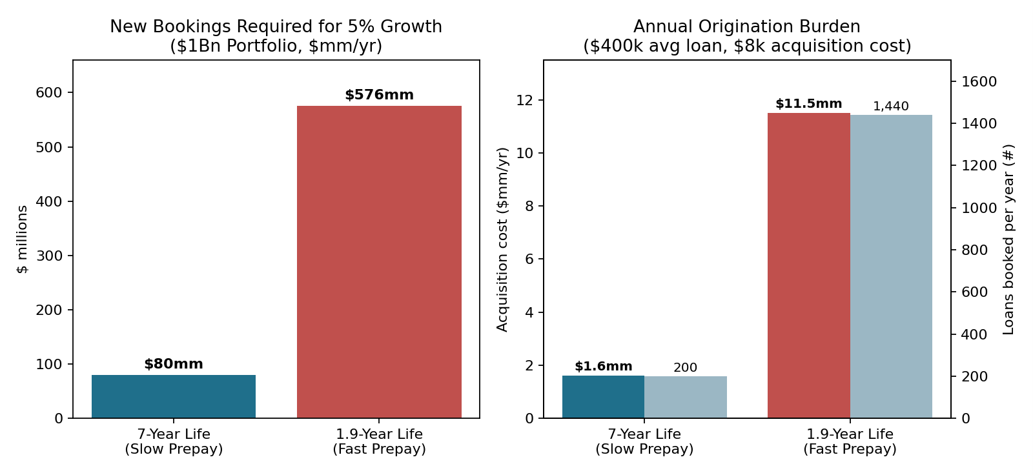
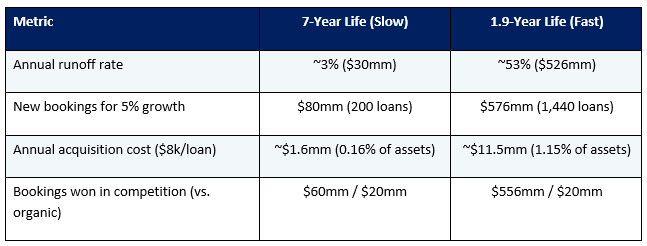
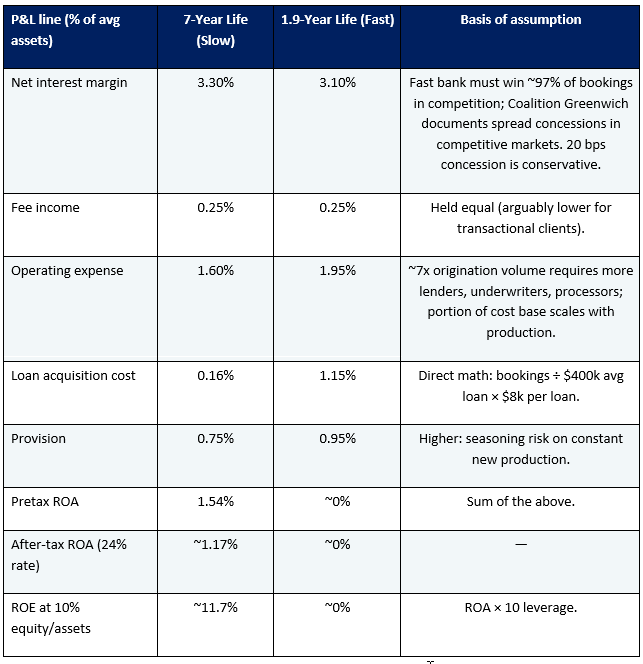
Table 2 shows the performance outcome for each assumption. Only two lines are pure arithmetic (the acquisition cost (bookings ÷ average loan size × cost per loan) and the leverage from ROA to ROE. The judgment calls are the 20-basis point margin concession, and the 35-basis point operating expense premium, both of which we believe are conservative given a sevenfold difference in origination volume. The results are consistent with RAROC pricing model output, which routinely shows negative risk-adjusted returns on smaller, shorter-lived commercial loans.
The Human Capital Trap: Transaction vs. Relationship Clients
The acquisition-cost math understates the damage, because origination runs through people. A commercial lender can effectively manage roughly 40–50 relationship accounts – calling regularly, cross-selling deposits and treasury management, spotting credit issues early. But at many banks, smaller loan size and management style, forces each lender to carry 100 to 120 accounts. At that load, the lender cannot service anyone deeply; every client becomes a transaction rather than a relationship. Transactional clients hold fewer deposits, generate less fee income, feel no loyalty, and shop every maturity, which accelerates prepayments further. It is a self-reinforcing loop: fast runoff overloads lenders, overloaded lenders create transactional clients, and transactional clients run off faster. Bank B, requires more loan bookings, is trapped in this loop; Bank A can staff to the 40–50 account standard and defend its book.
How to Structure Loans to Reduce Loan Payoffs and Extend Expected Life
Because commercial loans carry thin ongoing margins and heavy upfront origination costs, a loan only becomes profitable through a long, stable stream of earned margin. Banks can engineer longer expected lives through deliberate structuring choices:
- Real prepayment provisions. Symmetrical or yield-maintenance protection, step-down penalties (5-4-3-2-1), or defeasance transforms expected life. Assumability and permitted collateral substitution clauses can preserve the asset when the property sells or the borrower acquires new collateral.
- Longer fixed-rate commitments with hedging. Borrowers value 7-, 10-, even 20-year fixed-rate certainty. A bank that can offer long-term fixed rates via a hedge program while keeping a floating yield wins durable assets that competitors offering 5-year balloons cannot dislodge.
- Portfolio mix. Tilt away from inherently short-lived categories like construction, stabilization, tenant-improvement loans, substandard credits (which prepay when they improve), and lines of credit financing long-term assets. Focus on stabilized, term credits to strong sponsors.
- Relationship depth as a prepayment defense. Deposits, treasury management, and multiple credit facilities raise switching costs more effectively than any covenant – another argument for capping lender portfolios near the 40–50 account level where genuine relationship management is possible.
- Price for expected life. Most loan pricing models never measure expected life, and many banks do not track their historical prepayment speeds. Build expected-life estimates into pricing: a seemingly thin margin on a 10-year, prepayment-protected loan may be the correct market-clearing price for a highly profitable asset, while a fat spread on a 2-year transactional credit may never recoup its $8k origination cost.
Conclusion
Payoff waves are stark reminders that loan growth is a treadmill, and prepayment speed sets the incline. Two banks with identical portfolios can produce a double-digit difference in ROE purely because one built duration and stickiness into its book and the other did not. The drivers of that gap is simple arithmetic, not assumption. Before chasing the next competitive deal on price, ask the more important questions: How long will this loan stay on the books? What structure will keep it here? And is my team sized to manage relationships or merely to process transactions? Community banks that measure, price, and structure for expected loan life will run lower efficiency ratios, hold deeper relationships, and earn returns their fast-churning competitors cannot match.