
What $40 Trillion in Debt, Operation Twist, and the GENIUS Act Mean for Your Bank

Total federal debt crossed $40 trillion on August 19. That is roughly $32.3 trillion held by the public, $7.8 trillion intragovernmental. The same week, the 30-year Treasury yield touched its highest level since 2007, and a $25 billion long-bond auction cleared at the steepest yield since 2021.
For community bankers, none of this is abstract. The long end sets your mortgage pipeline, your CRE refinance conversations, and the marks on your AFS book. The short end sets your deposit competition. Both are being pushed around by fiscal arithmetic, by a Treasury Department improvising against it, and by the Federal Reserve that finds itself in a bind.
Why Governments Do Not Fix This Voluntarily
The political system has no internal mechanism for deficit reduction, just an external one. This is an incentive problem. The costs of fiscal correction are immediate, concrete, and fall on identifiable constituencies. The benefits are diffuse, deferred, and accrue mostly to whoever holds office later. No rational politician volunteers for that trade. In fact, most voters support the prudence of deficit reductions, until they are asked to pay higher taxes or accept lower services and transfers.
So, the deficit runs above 6% of GDP with unemployment near 4%, growth at trend, and equities at records – conditions under which, most argue, it should be closer to 3%. Congressional Budget Office’s (CBO) February baseline puts the FY2026 deficit at $1.9 trillion, or 5.8% of GDP, against a 50-year average of 3.8%.
The deficit gap can be attributed primarily on the last two decades of tax cuts – supported, largely, by both parties. Mandatory spending growth as the binding constraint of an aging population also does not help. In summary: no credible plan exists to lower spending or increase taxes, and none is coming absent pressure.
Which leaves the bond market as the only enforcement agency. We do not believe that the U.S. faces a UK-style “sudden stop,” largely because there is no obvious alternative asset to rotate into. Instead, we are facing a slow grind of higher-for-longer rates showing up in mortgages, auto loans, and credit cards rather than a dramatic auction failure. This situation is not ideal for community banks as it likely means that expenses, and interest cost rise faster than revenue.
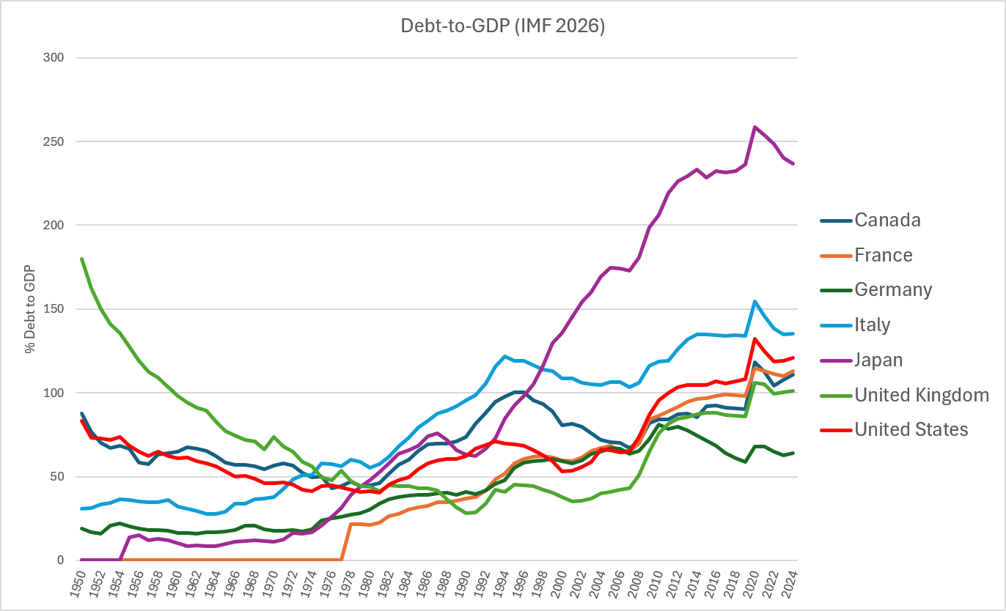
US at 100% of GDP but Japan at 230%
IMF data show U.S. general government debt at 120% of GDP in 2024, up from 65% in 2007 and 41% in 1980. That places the U.S. above the U.K. (101%), France (113%), and Canada (110%), far above Germany (64%) – and well below Italy (135%) and Japan (236%).
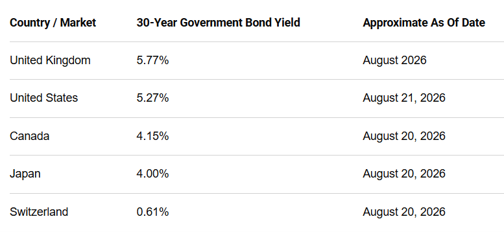
Now compare that ranking to what the long end actually charges. As of late August 30-year government yields stood at roughly 5.77% in the U.K., 5.27% in the U.S., 4.15% in Canada, 4.00% in Japan, and 0.61% in Switzerland. Japan carries nearly twice America’s debt ratio at four-fifths of America’s yield. The level of debt, by itself, does not price the bond.
What prices it is who owns the debt, in what currency, with what alternatives, expected inflation, and the required term premium. Japan’s is overwhelmingly domestically held and yen denominated. America’s advantage is different and larger: the dollar remains the reserve currency, at roughly 57% of allocated global FX reserves in Q1 2026 versus about 20% for the euro and 2% for the renminbi. That produces a structural, price-insensitive bid for Treasuries from central banks, exporters, and now stablecoin issuers – this has been termed the “exorbitant privilege.”
Two things follow. First, the U.S. can run deficits that would have already triggered a funding crisis in a peripheral economy. Second, that privilege is precisely why the disciplining mechanism arrives late. It delays the reckoning; it does not cancel it. Nor is it free-standing: it rests on institutional credibility, central bank independence, and predictable rule of law. The recent yield increases is mainly an inflation and term premium story. The market is pricing a term premium on current U.S. governance.
$64 Billion Is no Answer to a $40 Trillion Question
On August 19, Treasury said it would “at least double” its liquidity-support buybacks in the 10-to-30-year sector, from $2 billion to at least $4 billion per operation, effective September 9. The 30-year dropped nine basis points on the news. By the next afternoon yields had erased the entire move and gone higher, forcing Secretary Bessent to clarify that $4 billion was a floor, not a ceiling.
What the Treasury Secretary did was a small-scale “Operation Twist” that in itself will have little enduring impact. The magnitude explains why. Barclays sized the increase at roughly $16 billion a quarter, or $64 billion annually, which is about 15% of yearly 20- and 30-year issuance. Set that against $32 trillion in marketable debt and net borrowing north of $2 trillion a year. The Fed’s 2011–2012 Operation Twist moved $667 billion. The current operation is sized for liquidity support, not duration removal, and the market read it correctly within 24 hours, and it will not build a rate forecast on Treasury engineering the long end lower.
The GENIUS Act and the Bill that Comes Due
The GENIUS Act requires payment stablecoins to be backed 1:1 by a narrow list of assets: cash, insured demand deposits, Treasury bills with 93 days or less to maturity, overnight Treasury repo, and government money funds holding the same. Every dollar of compliant stablecoin growth is, mechanically, a bid for T-bills.
The sector is around $308 billion today, with Tether alone reporting roughly $141 billion in Treasury exposure, which is a position it claims ranks 17th among global holders. Standard Chartered projects $0.8-1.0 trillion of incremental bill demand by 2028. Brookings models first-round net demand of $400 billion to $2.3 trillion by 2030, depending on whether balances migrate out of money funds and bank deposits (largely a wash) or come from abroad (net new).
For a Treasury facing a buyers’ strike at the long end, cheap and abundant demand at the front end is an obvious out. Bills already run about 21.7% of outstanding debt and above the roughly 20% average Treasury Borrowing Advisory Committee recommends as the right balance between cost and rollover risk, and above 20% continuously since September 2023.
Here is the risk, in language every banker understands: this is funding long-duration obligations with overnight money. The maturity profile already shows $10.58 trillion or 33% of marketable debt repricing within twelve months, with another $11.22 trillion in the one-to-five-year bucket. Net interest is $1.0 trillion this fiscal year, 3.3% of GDP and 18.6% of federal revenues, both records. CBO projects $2.1 trillion by 2036. Every basis point of policy rate now flows through to a third of the stock within a year. Term-out is the fix but the market will not take it at an acceptable price.
What This Means for Banks
In addition to rising inflation driving up operating costs at banks, assume higher-for-longer at the long end and plan the bond portfolio and loan book accordingly. Expect front-end competition to intensify as stablecoin and money-fund alternatives absorb balances that used to sit in core deposits. The yield curve may force 7% mortgages, softer loan demand, and a Treasury that has just demonstrated the limits of its own toolkit. Worse, the US Treasury, now shifting more debt into the front end, may be at odds with the Federal Reserve which has expressed its desire to raise the Fed Funds rate.