In our first part of the Fed-bursting-the-everything-bubble, we discussed how and why some banks would struggle with interest rate, credit, and liquidity risks. In our second part of the series, we covered how monetary tightening and stagflation will cause cash flow constraints for borrowers and create credit risk for banks. In this article, we analyze why 75% LTV may not protect banks from credit risk on commercial loans and why there is only one source of loan repayment.
Background
We established that stagflation (defined as high inflation and likely accompanied by higher interest rates and stagnant or no growth) could be toxic for real estate projects. Few bankers working today have any experience with how destructive stagflation can be since this environment last occurred in the 1970s.
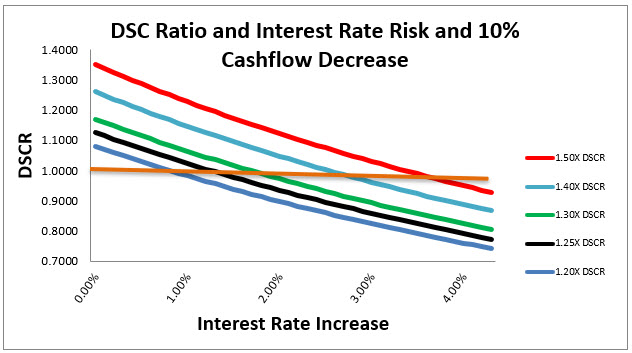
In a stagflation environment, as interest rates rise and cash flow (earnings before interest, taxes, depreciation, and amortization (EBITDA), or net operating income (NOI)) decreases, the borrower’s capacity to service debt as measured by the debt service coverage ratio (DSCR) decreases rapidly. We analyzed various starting DSCRs and stress-tested for increases in interest rates and decreases in cash flow.
We looked at up to 4.00% increases in rates and 10% and 20% decreases in cash flow. The graph below shows five loans at various starting DSCRs and charts the impact of rising rates and a 10% decrease in cash flow. Loans below 1.50X starting DSCR cannot withstand the current market expected rise in interest rates if cash flow decreases by just 10%. A loan starting at 1.20X DSCR dips below 1.0X if cash flow decreases by 10% and rates increase by just 80bps. As a reference, the market expects short-term rates to increase by another 1.77% for the rest of 2022.
We concluded that obligors showing less than 1.50X DSCR would be most at risk, but the average community bank underwrites to 1.20X DSCR. Many bankers responded that their loan-to-values (LTVs) are low and expect that the secondary source of repayment will protect the bank’s capital.
In this article, we argue that there is only one source of repayment – cash flow, and that collateral values are directly tied to cash flows, and bankers should reconsider how they assess collateral as a source of loan repayment.
Determinants of LTV
As a short recap of valuation principles, the value of real estate is determined by discounting the income that the property produces at a discount rate. The most simple form of this calculation is the direct capitalization method. The value of the real estate using the direct capitalization formula is as follows:
Value = NOI/Cap rate
The cap rate is based on future NOI growth, the risk of that NOI, and the risk-free rate. Very simply, the formula for the Cap Rate is as follows:
Cap rate = Discount rate – Growth rate of NOI.
The Discount rate is the risk-free rate plus the risk premium for NOI volatility. If interest rates go up, the discount rate goes up proportionately, and the Cap rate rises. The mechanism is straightforward – higher rates lead to lower real estate prices unless or until the property NOI can be increased proportionately with escalation clauses or re-leasing.
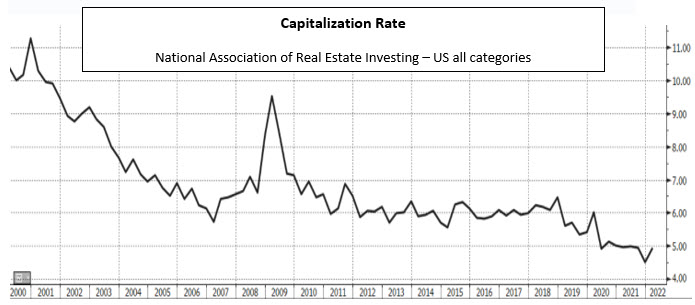
Cap rates for all US properties are at an all-time low. The graph below shows US Cap rates on all RE categories currently at 4.94 (just off the all-time low of 4.50 in December 2021).

Cap Rate and LTV Relationship
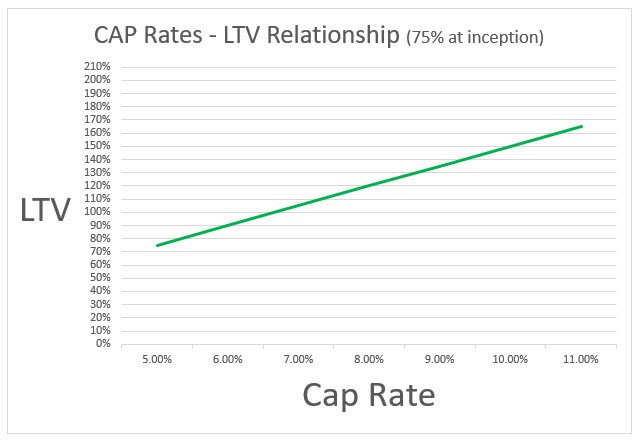
When cap rates rise without any changes to expected NOI or volatility around that NOI (the risk premium for holding real estate), LTV also rises. That relationship can be quantified and is demonstrated in the graph below. For loans starting at 75% LTV and 5% Cap rate, every 1% increase in the Cap rate increases the LTV by 15%. Suppose nothing else changes in the real estate market other than an increase in the discount rate. In that case, banks relying on real estate value for collateral will experience a very rapid erosion of that coverage. The same decline occurs at a different starting Cap rate. However, the reduction in value is less extreme at a lower starting LTV, and there is more room for erosion because of the lower starting leverage. For example, at 50% starting LTV, every 1% increase in the Cap rate increases the LTV by only 10% (instead of 15%).
The graph above shows the impact on LTV from rising cap rates that may be caused by rising interest rates. However, in a stagflation economy, the lender should also stress test NOI. The graph below shows LTV levels for 10% and 20% decrease in NOI for the same increased cap rates.
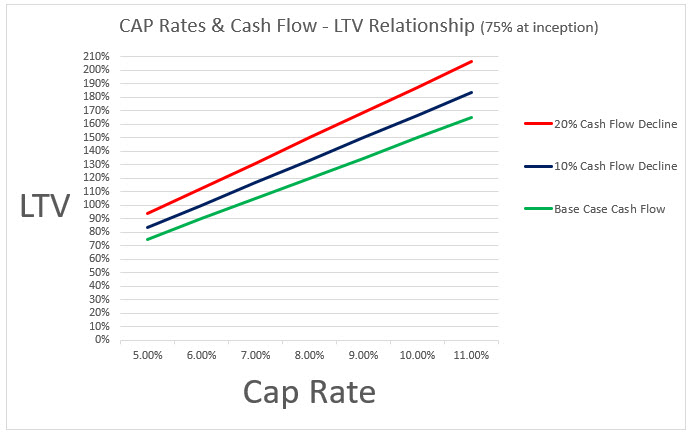
The key takeaway for bankers is that with a 10% decrease in NOI, the 75% starting LTV loan reaches 100% LTV with only a 1% increase in Cap rates, and with a 20% decrease in NOI, the 75% starting LTV loan reaches 100% LTV with only a 33bps rise in Cap rates.
The upshot is that cash flow affects DSCR and LTV directionally – as cash flow decreases, DSCR and LTV are negatively impacted. Further, the rise in interest rates and decrease in cash flow are expected to occur in a stagflationary environment, and the coincidence of higher interest rates and lower cash flow exacerbates the deterioration of both DSCR and LTV.
To put it another way, in a systemic or non-diversifiable risk environment (like stagflation) LTV is not another source of repayment. LTV is directly tied to cash flow and should not be used as another underwriting criterion.
Conclusion
Instead of viewing DSCR and LTV as separate underwriting criteria, bankers should look at cash flow and right-size loans based on debt yield. The DSCR and debt yield will right-size loans so that credit mistakes caused by historically low Cap rates, lengthy amortization periods, and still-low interest rates do not cause a false sense of credit security. We will discuss this concept more in future blogs.
