
Using the Bank Balance Sheet Monitor [Free Tool]

The Bank Balance Sheet Monitor gives bank executives a weekly and year-to-date view of how the industry is changing across loans, investments, liquidity, deposits, and other funding sources. Rather than looking at a bank’s own results in isolation, management can compare the entire industry, the 25 largest banks, and community banks to help banks understand if they are gaining or losing ground relative to the industry. This article explains the dashboard’s major components and shows how to convert the data into better balance-sheet decisions.
Why This Monitor Matters
Most banks manage from internal reports that explain what has already happened to their own balance sheet. Those reports are essential, but they often lack the outside context needed to determine whether a result reflects bank execution, an industry-wide shift, or a competitive change. The Bank Balance Sheet Monitor adds that context by organizing public Federal Reserve and Office of Financial Research data into a practical management view. Executives can use it to test assumptions, identify inflection points, and ask better questions before changing pricing, liquidity, investment, or growth strategies.
Understanding the Dashboard
1. The Quick View
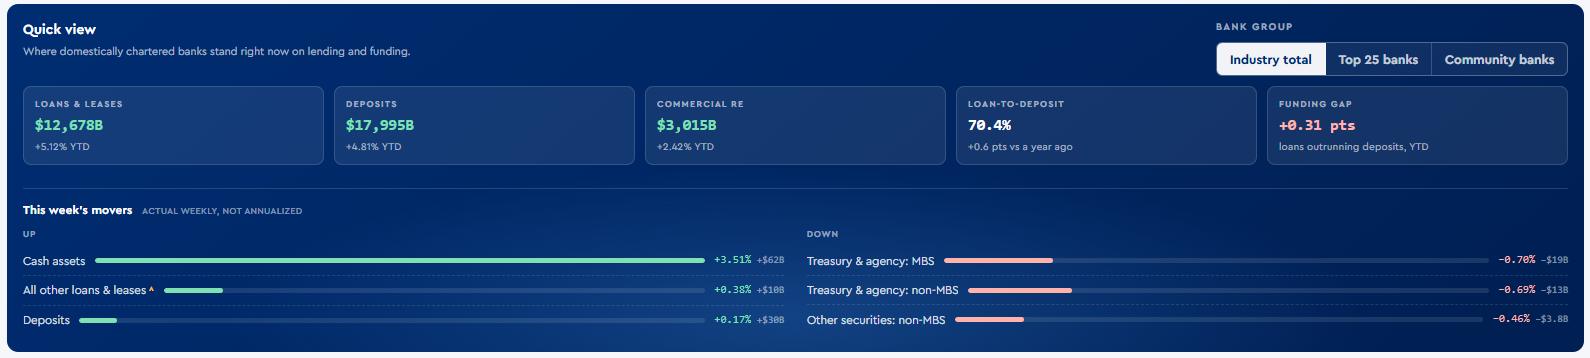
The Quick View provides an executive summary of what is happening to loans, deposits on a year-to-date basis, plus highlight the top three categories on bank’s balance sheets that have increased and the top three categories that have decreased.
2. Line-Item Explorer
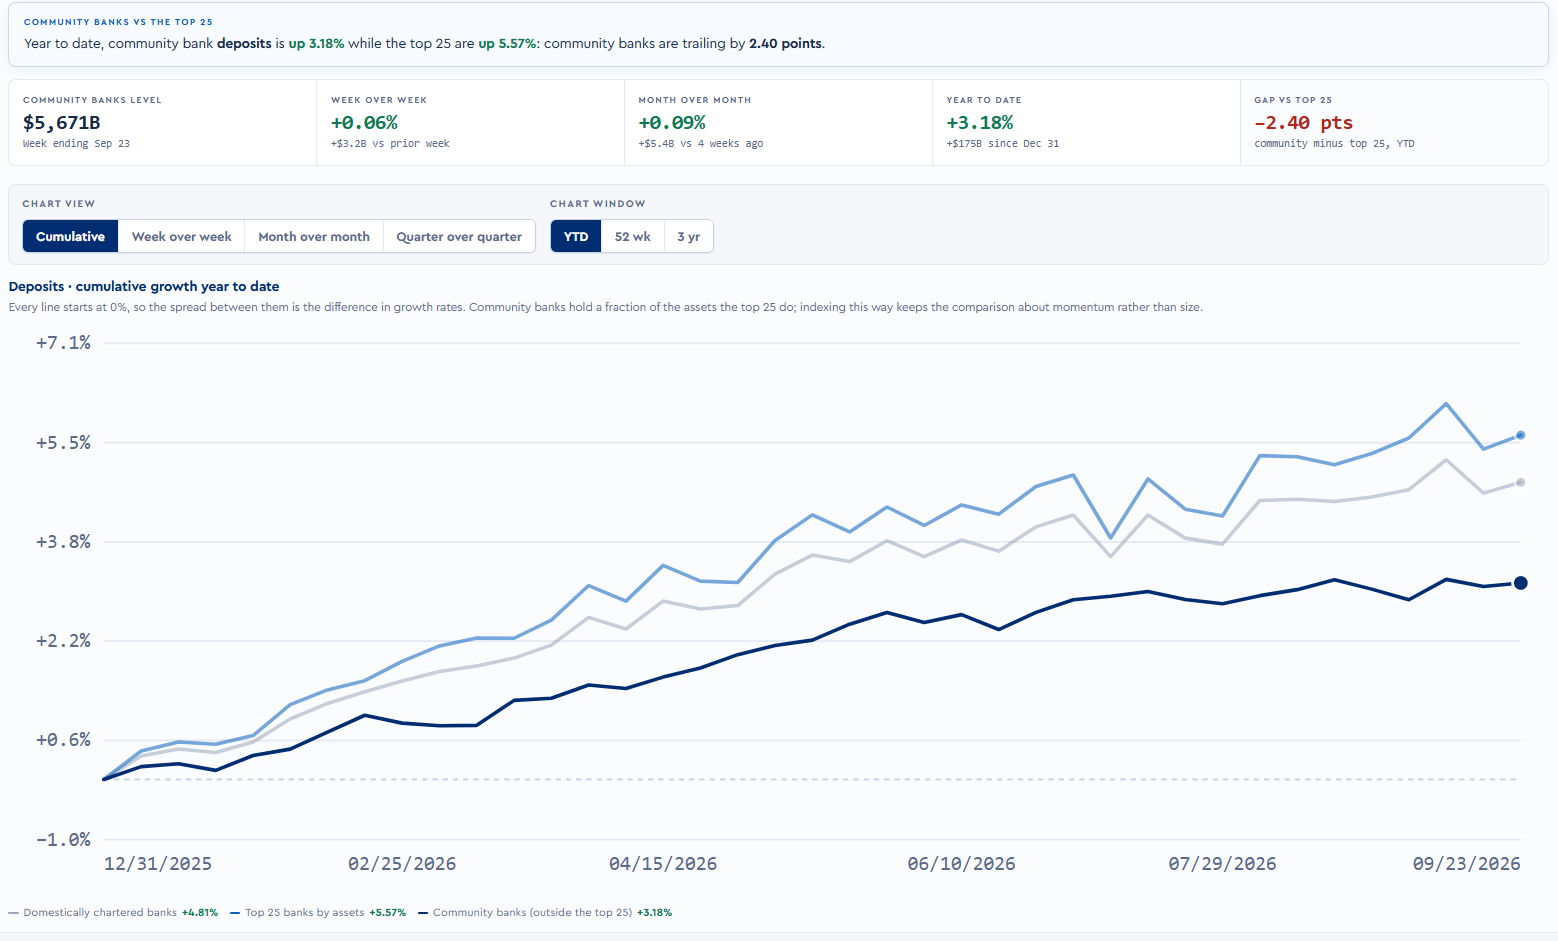
The line-item explorer lets users select a balance-sheet category and compare the industry total, the top 25 banks, and community banks. Users can change the measurement basis, such as week-over-week (WoW), month-over-month (MoM), quarter-over-quarter (QoQ), year to date (YTD), or year-over-year (YoY), and view cumulative or annualized growth across year-to-date, 52-week, or three-year windows.
Executive use case: Compare the bank’s internal loan or deposit growth with the community-bank cohort. If the bank is declining while the cohort is growing, management should investigate execution, pricing, product, market, or relationship-management issues. If both are declining, the response may need to address a broader market condition rather than a purely bank-specific problem.
An example is below for deposits where you can see the cumulative trend YTD and see how far ahead or behind community banks are to the Top 25. For this week, community banks lag the Top 25 banks by 2.4% absolute points with a deposit growth rate of 3.18%.
3. Assets and Liabilities Table
The assets and liabilities table provides a broader view of the selected bank group across the major balance-sheet lines. The dashboard defaults to seasonally adjusted information and also provides unadjusted data. Seasonally adjusted data helps reveal the underlying direction after recurring calendar effects are removed; unadjusted data shows the raw series more commonly seen in market presentations.
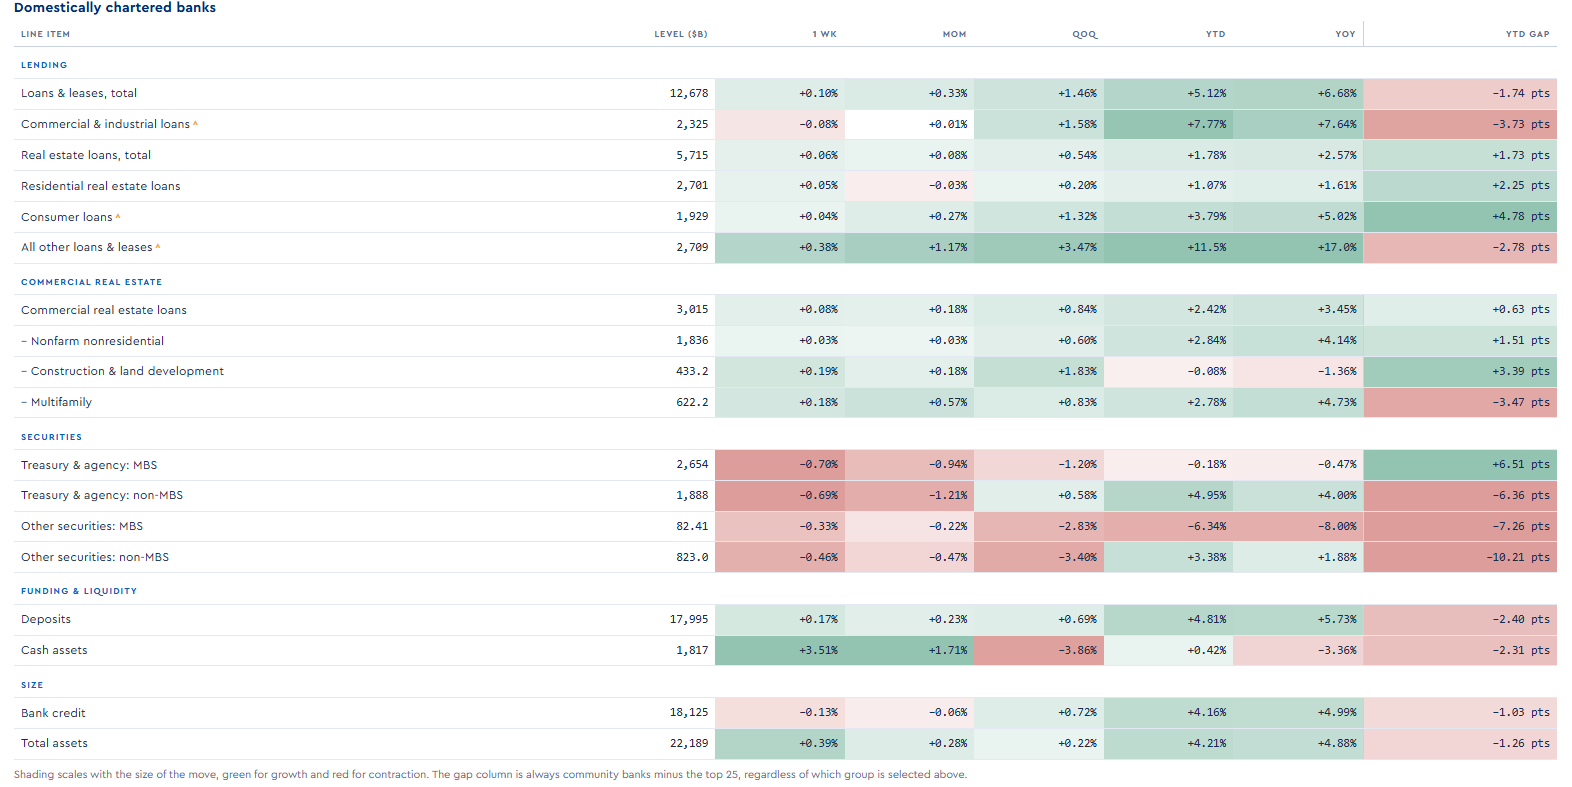
Executive use case: Review loans, securities, cash, deposits, and wholesale funding together. Loan growth funded by core deposits creates a different risk and earnings profile than the same growth funded by borrowings or securities runoff. This table helps management avoid drawing conclusions from a single line item without seeing the corresponding changes elsewhere on the balance sheet.
The matrix is color-coded so bankers can easily see individual assets and liabilities that are growing and shrinking. In addition, bankers can view the gap for each line item between community banks and the Top 25.
Use the gap as a strategic early-warning indicator. If large banks are gaining deposits faster, executives can examine whether digital convenience, treasury capabilities, pricing, brand reach, or customer migration is driving the difference. If community banks are outperforming, management can determine whether its own bank is participating in that advantage.
4. Money Supply Context
This is our favorite section. The money supply section compares year-over-year M2 growth with community-bank deposit growth. M2 represents the broad pool of money from which bank deposits are drawn. When community-bank deposits grow more slowly than M2, the cohort is losing share of the nation’s money to large banks, money market funds, or other nonbank alternatives. The displayed statistical relationship helps describe how closely the two growth series have moved together, but it should not be treated as proof of causation.
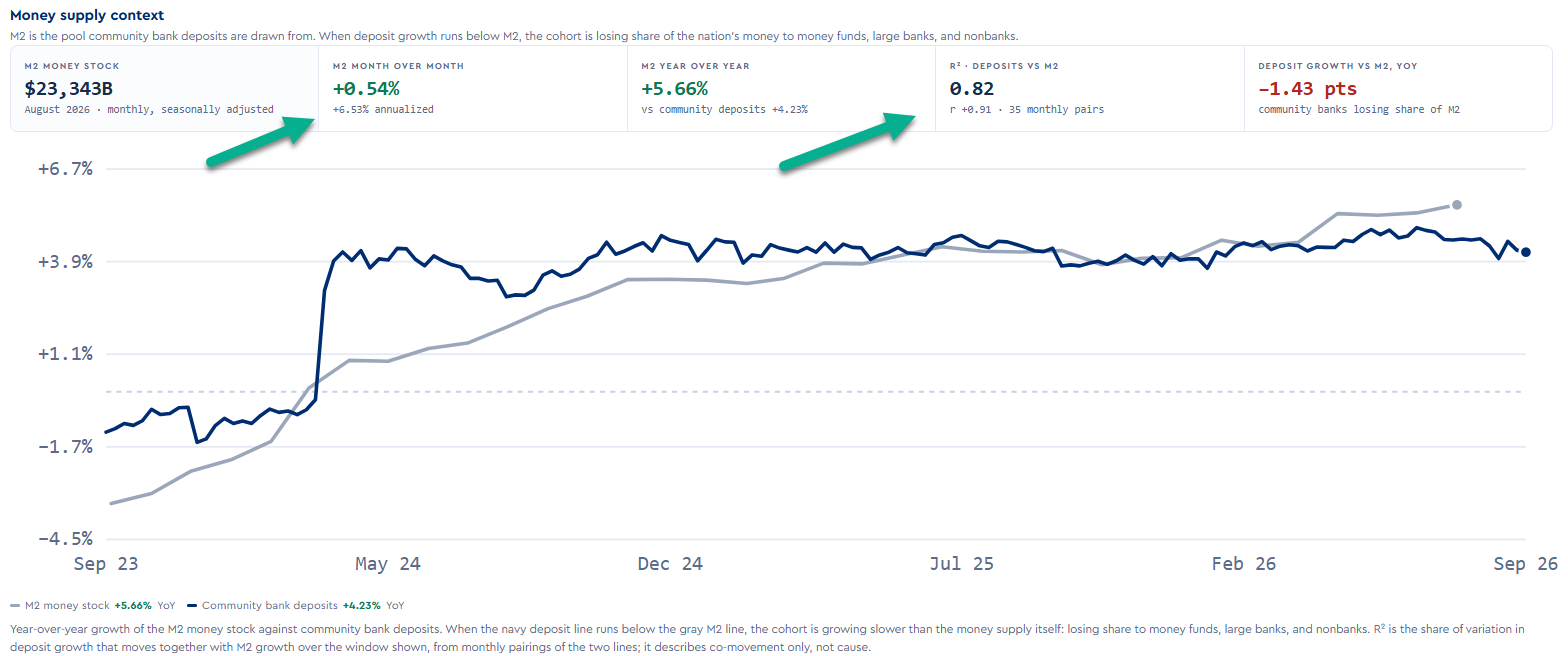
Executive use case: We provide the cumulative correlation between M2 and bank deposits. This is currently a strong 82%. This is an effective starting indicator when you are pricing deposits. A growing M2 money supply means you can reduce your pricing. A shrinking supply means the opposite. Currently, the M2 money supply is growing at a 6.53% annual pace, yet bank deposits are growing at a 5.73% pace which means we are losing ground to other investment holdings such as Treasuries and money market funds. This comparison is useful when setting deposit goals, evaluating market-share gains, and determining whether slower growth reflects inadequate acquisition or retention.
5. Inside the Money Funds
This section uses Office of Financial Research data to show what money market funds earn by tenor and how their total investment holdings have changed. It provides a direct view of one of the banking industry’s largest commercial competitors for liquid customer balances.
Executive use case: Use money-fund yields and asset growth as a reference point for customer alternatives. The correct response is not necessarily an across-the-board rate increase. Management can instead target at-risk balances, protect primary operating relationships, deepen treasury-management usage, and distinguish relationship deposits from rate-sensitive funds.
At present, these money market funds are growing at a 10% clip and currently at a 3.67% rate. As can be seen, because these funds have shorten duration as to not lose ground to their index should they guess the Federal Reserve target rate wrong, they have some of the lowest rates of the year compared to bank deposits.
Putting The Bank Balance Sheet Monitor Into Action
Inform ALCO: Begin the balance-sheet discussion with the external environment before moving into the bank’s internal results. A brief review of industry, large-bank, and community-bank trends helps management interpret its own variance reports and separates market effects from execution issues. Weekly movement can flag an inflection point, but it can also reflect volatility. Executives should compare weekly, monthly, quarterly, year-to-date, and annual views. A trend that persists across several periods deserves more attention than an isolated weekly change.
Challenge the Budget and Funding Plan: Industry trends provide a reality check for growth assumptions. If the bank expects to grow loans or deposits materially faster than community-bank peers, management should identify the markets, teams, products, or customer segments that will generate the share gain and then assign the appropriate amount of capital. Excess growth isn’t free. The monitor also helps test whether planned asset growth is consistent with realistic deposit generation and acceptable reliance on wholesale funding.
Establish Management Triggers: The monitor becomes more valuable when observations lead to predefined actions. Examples include community-bank deposits trailing M2 for several periods, wholesale funding growing faster than core deposits, loan growth materially exceeding deposit growth, or the bank underperforming its peer cohort for two consecutive quarters. Each trigger should have an owner, an escalation threshold, and a defined set of possible responses.
The Bank Balance Sheet Monitor is most useful when it is treated as a management tool rather than a collection of charts. It gives executives an independent benchmark for understanding industry direction, testing internal assumptions, and identifying where the bank is gaining or losing position. Used consistently, it can improve conversations around deposit pricing, liquidity, loan growth, investment strategy, and wholesale funding—while helping management act before a developing trend becomes a balance-sheet problem.
See and bookmark the Bank Balance Sheet Monitor here:
The tool featured in this article lives in our free portal, next to the resources, dashboards, and calculators that over a thousand community banks use to make sharper decisions.You've read the article. Now use the tool.