
A Step-By-Step Guide To Bank Peer Group Analysis [Free Tool]

One of the most common mistakes that bankers make is benchmarking their institution against the wrong peer group. Many management teams spend hours discussing how their net interest margin (NIM) compares to the industry average, whether their efficiency ratio is above or below peers, or how deposit growth stacks up against other banks. The problem is that the peer group is often selected by regulators, consultants, or asset size buckets rather than actual competitors. In this article, we explore this challenge and provide you a tool for enhanced peer group analysis.
The Problem
If you’re a $1.5B bank in the Southeast competing against several regional institutions, comparing yourself to every bank between $1B and $2B billion in assets may tell you very little about your actual competitive position. The better question might be – How am I performing against the banks my customers could realistically choose instead of me?
To answer this question, we will break it down step by step.
Follow Along
If you are a bank and you would like to see this analysis for you specifically, go HERE , pull up your bank on the left side and see how you rank against various peer groups.
You've read the article. Now use the tool.
The tool featured in this article lives in our free portal, next to the resources, dashboards, and calculators that over a thousand community banks use to make sharper decisions.
Step 1: Define Your Peer Group(s)
This is the most important step. Most peer analyses begin with asset size which we would argue is the last filter to use.
We would do the following:
- Geography
- Customer segment
- Commercial banking focus
- Deposit strategy
- Branch footprint
- Product mix
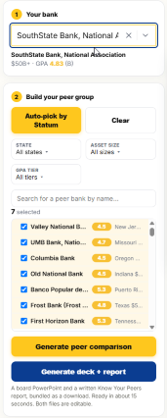 First, pull up your bank.
Then use the “Auto-pick” is the default and will provide you with a group of similar banks around your asset size. This is a starting list, not a competitor list.
If you are $800 million in Peoria, size-match will land you in other states. This might be useful if the goal is to understand how other $800mm banks perform. However, this is useless if the question is what the shop across the river is paying for operating accounts this week. You can now narrow down to similar sized banks in your state. This is how most banks choose a peer group and helps as these are most likely the banks competing for the same customers in similar markets.
Further drill down and select your state and/or further customize your peer group from the bottom choices.
Our best practice is to create multiple peer groups. Specifically, we would create the following:
- Peer group of competitor banks in our market roughly around our size, +- 25% of total assets.
- Peer group of banks our size and orientation across the nation.
- Peer group of banks that have our orientation that perform better than us either in the top 10% of overall performance.
- Various other peer banks that we want to emulate in certain areas such as deposit structure. These banks may not be overall top performers but may be doing things right when it comes to generating fee income, having low deposit beta, or are generating outsized returns.
Step 2: Look at the Shape and Then The Color Grid
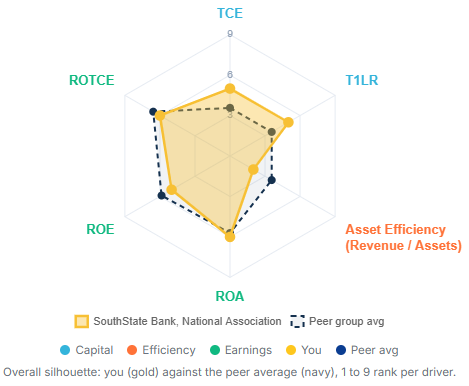
When it comes to bank peer group analysis, first, we look at the shape of the bank against the peers to see where a bank does better, or worse against six common metrics covering capital, efficiency, and earnings. This gives us a basic orientation. These metrics are chosen because they are an indication of survival. Outperform on these metrics an you have a lower probability of being shut down.
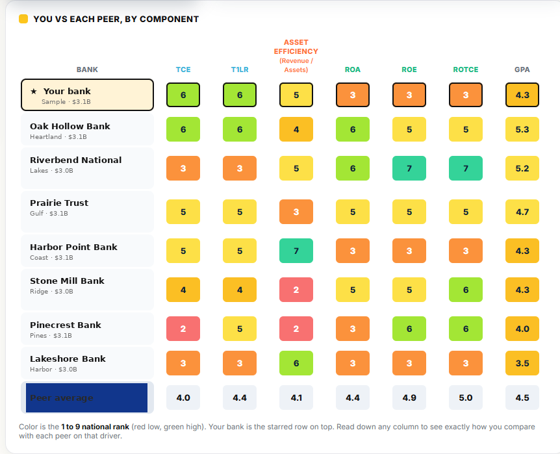
Next, we look at the scorecard which is a red-to-green grid of you versus each peer, column by column. Tangible common equity. Tier 1 leverage. Revenue over assets. ROA. ROE. ROTCE. Color is the 1-to-9 national rank. Red is low. Green is high. Your bank is the starred row on top.
Read down a column, not across a grade. Two banks can print the GPA grade and not be in the same conversation. High ROA and low ROE in the same set is usually a leverage and capital-velocity problem, not an earnings problem. ROTCE sitting next to ROE is how you see it. A 3 on ROA next to a 6 on TCE is a different ALCO item than a 3 on both. The grid is there so nobody leaves the meeting arguing over a single metric. Here, you train your board to look at a composite of numbers.
Step 3: Review the Board Scorecard
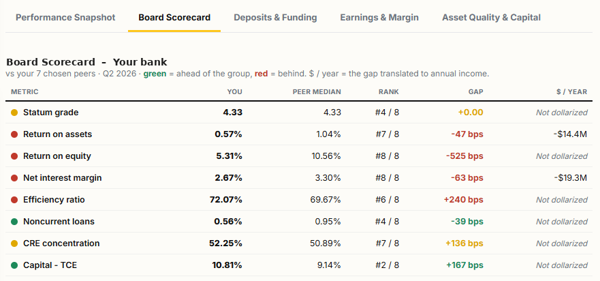
The next place we go in bank peer group analysis is the Board Scorecard view.
A board does not act on a 15-basis points difference of some metric. It likely acts on what that 15 basis points does to pretax income. The Board Scorecard is built that way. Each row is you, the peer median, a rank inside the set, the gap in basis points, and the same gap in dollars a year where the math is clean.
On the sample layout, a 63-basis point net interest margin (NIM) gap against the seven peers is priced at about $19 million a year on $3.1 billion of earning assets. A 47 basis point ROA gap is about $14 million of net income. Those are the right units for a director presentation. However, they are the wrong units to make a financial forecast. Treat the dollars as a diagnosis. This helps you understand where you want to improve and what improvement could mean to the bottom line.
Board members generally want answers to four questions:
- Are we winning?
- Where are we falling behind?
- How large is the gap?
- What do we need to do next?
A scorecard provides a quick snapshot of profitability, funding strength, credit quality, capital and growth.
Rather than reviewing dozens of isolated metrics, we look and point out patterns.
For example, if your bank shows above-peer loan growth, below-peer deposit growth and rising funding costs, your bank has already identified a strategic issue. This is to say that growth is being funded by increasingly expensive liabilities.
That insight is much more valuable than simply knowing your deposit growth ranked sixth out of ten peers.
Step 4: Focus on Deposits
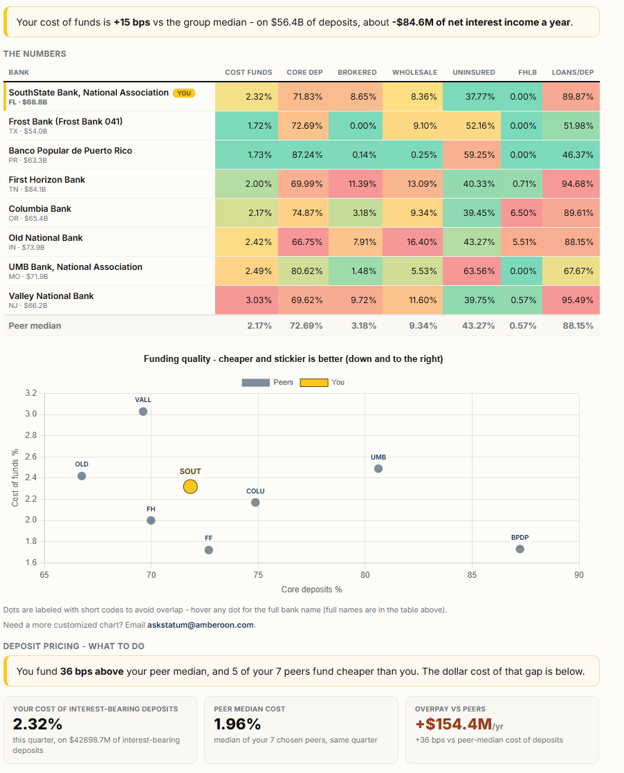
To us, funding is king, so we go there once we have an overall view of quarterly performance. We want to emulate the peers that are lower and to the right of us in the Funding Quality grid below. We then go back up and look at how our peers fund themselves and at what cost. This bank peer group analysis tool helps clearly understand the overall funding picture of any bank in a clear, color-coded format that helps banks narrow down where funding cost is being driven up.
Step 5: Look at Margin Composition
It would be best if we were able to risk-adjust these performance numbers. We can’t, so we make some adjustments and live with the data we have but knowing we have limitations.
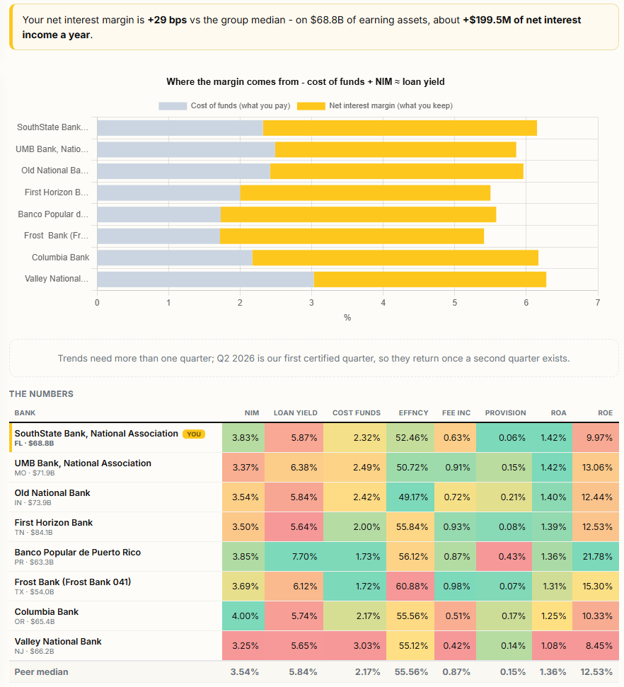
Understanding the source of performance is often more important than the performance itself.
Step 6: Asset Quality and Capital
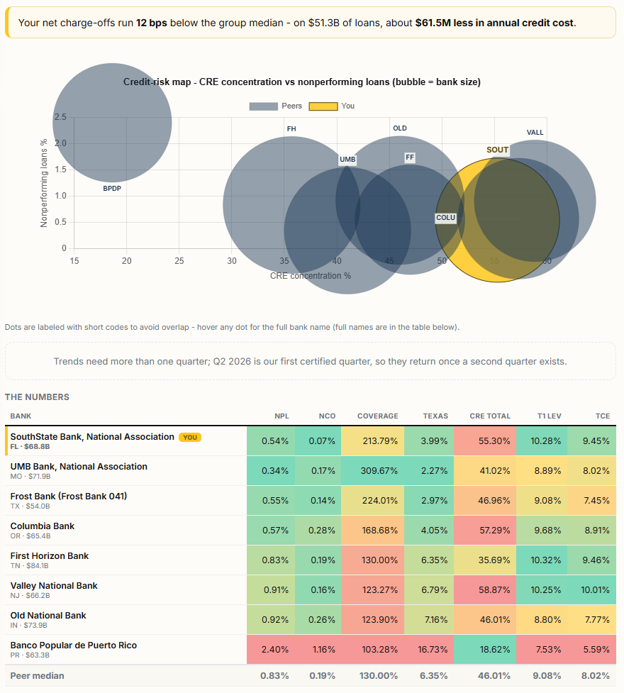
When we look at asset quality and capital, we have the view that we are trying to look into the future and the peer analysis becomes an early warning system. We look at non-performing assets, delinquencies, and net charge offs against the capital ratios. We then look at CRE concentrations for the only purpose of understanding what the regulators will see.
For us, CRE doesn’t much matter as it is not an indicator of diversification (Our analysis HERE).
The goal each of these metrics is to not merely to determine where you rank, but to identify trends before they become regulatory findings.
If your bank remains within regulatory guidelines but consistently ranks in the weakest quartile of your peer group for CRE concentration, that deserves discussion. The market often identifies risk long before an examination report does.
The CRE against nonperforming loans is a bubble map, with bubble size as bank size. A cheaper NIM bought with a higher CRE load, thinner coverage, or unused equity will show up here even when the scorecard still calls the margin close. Tangible common equity, Tier 1 leverage, net charge-offs, and coverage sit in the same numbers table.
Final Thought
The biggest lesson from peer analysis is that the average bank is rarely your competitor.
The most valuable benchmarking happens when you compare yourself against the institutions your customers consider, your lenders encounter, and your treasury officers compete against every day. Next to that, it is finding banks that are doing things right and dissecting how to emulate them.
Coming up, we will provide more screens for your bank to do deeper analysis on both your peers and your bank. Until then, check out the Know Your Peers data, click to download a presentation ready report, and see how you can improve your bank.
Until then, check out your bank or other banks against its peers:
You've read the article. Now use the tool.
The tool featured in this article lives in our free portal, next to the resources, dashboards, and calculators that over a thousand community banks use to make sharper decisions.