Bank Health Performance – Here is Your Future

As banks finish strategic planning, it is helpful to understand your bank’s performance assuming you DON’T make any changes. A statistical reliable model that factors historical performance, current business model and future market assumptions allows bank executives to more accurately apply capital, resources, and risk to improve performance with a higher degree of confidence. In this article, we describe how this can be done, and how bankers can calculate health performance predictions for every bank in the U.S.
Background and Methodology for Bank Health Performance
Similar to last year, we have partnered with Amberoon to bring out this upgraded analytical package ranking bank health performance. They used data from 4,412 banks across multiple economic cycles from Q1 2021 through Q2 2025 to forecast performance 18 months in advance with impressive, and measurable, accuracy.
Each bank’s competitive position is determined by relative performance across key indicators such as capital formation, amount of equity, leverage ratio, efficiency, and return. Each factor receives a 1-9 rating (C- to A+) based on relative performance against all US banks. The grade point average (GPA) represents the average across all factors, providing an overall competitive positioning forecast 18 months out. A score of “5” is average and a score of “9” is elite.
In addition to the overall performance composite prediction, the following is also forecasted:
- Efficiency Ratio
- Tier 1 Leverage Ratio (T1LR)
- Asset Efficiency Ratio (AER)
- Return on Assets (ROA)
- Return on Equity (ROE)
- Tangible Common Equity (TCE)
- Return on Average Tangible Common Shareholders’ Equity
Performance-Predictability Correlation
In addition to forecasting the above elements, we also look at the accuracy of the predictions. No surprise, institutions that demonstrate consistent operational metrics, stable performance patterns, and predictable responses to market conditions tend to be more predictable. In other words, statistically, these banks have a lower error rate. Banks that fall into this category can have high confidence in the forecast.
To capture the accuracy, we also rate banks by three tiers. These tiers break down to the following:
Tier 1: High-Accuracy Banks (33.5% of sample)
- Forecasting Accuracy: ±0.262 points
- Average Competitive Ranking: 5.41 (above-average performance)
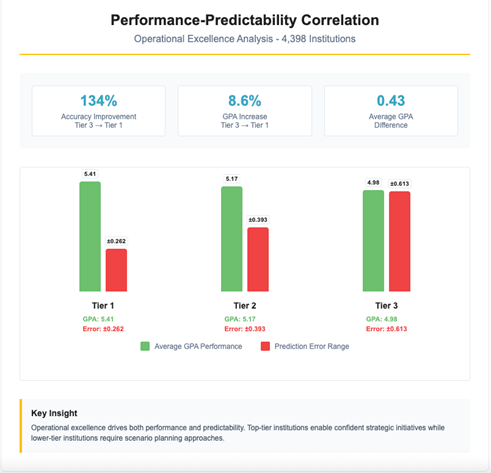
Tier 2: Medium-Accuracy Banks (35.7% of sample)
- Forecasting Accuracy: ±0.393 points
- Average Competitive Ranking: 5.17 (solid performance)
- Strategic Approach: These institutions show generally stable patterns with moderate variability. Their forecasts are reliable for strategic planning, though with slightly wider confidence intervals.
Tier 3: Standard-Accuracy Banks (30.8% of sample)
- Forecasting Accuracy: ±0.613 points
- Average Competitive Ranking: 4.98 (below-average performance)
- Improvement Path: These banks exhibit more volatile performance patterns, making their long-term positioning less predictable. Strategic planning requires broader scenario planning and more frequent forecast updates.
Strong negative correlation exists between competitive performance and forecasting variability. Banks achieving higher GPAs consistently demonstrate more predictable performance patterns, creating a virtuous cycle where above average operational performance enables both better competitive positioning and more reliable strategic planning.
Banks can improve their predictability tier by focusing on efficiency, loan structuring/pricing and deposit management.
Critical Insights from the Bank Health Performance Data
The findings establish three critical insights.
First, the stable operations of most banks demonstrate predictable patterns with 78.5% of institutions forecasted within ±0.8 points on a standardized 1-9 performance scale. That is, because of strategy, balance sheet composition and infrastructure, the future of most banks can be accurately categorized.
Second, and a derivation on the above point, banks exhibit distinct predictability profiles, with the top tier achieving high-reliability forecasting (±0.26 points average error) enables confident long-term strategic planning. This means that not only can we accurately categorize banks on a forward looking basis, but those categories allow for the accurate prediction of critical bank metrics. This allows us to apply the expected economic environment to include geographical influence, to accurately forecast earnings.
Third, competitive positioning is substantially determined by three performance drivers accounting for 42.2% of variance—all directly manageable through executive action.
Insight – The Factors That Matter
We have covered these factors before, but we will do so again in a slightly different light. These factors are risk-adjusted return, loan portfolio productivity and efficiency. As usual, the transactional and specialty captive finance are ranked the safest due to their outsize profit (wide risk-adjusted margins and low efficiency ratio) and capital generation.
The overarching skill here is for bank executives to be able to deploy capital efficiently. It’s selling more profitable products to more profitable customers by being in the right lending lines with the right loan structures. It is choosing the credit risk you want to take on and then pricing it correctly, so you get paid for the risk you are taking.
Note that while deposits are bigger contributors to profitability than lending, lending has an outsized impact on the financial health of your bank because of the embodiment of credit risk and greater interest rate risk. Banks rarely take five-year or more interest rate risk for deposits but routinely take that risk for loans. Having longer loan and investment duration contributes to greater financial variability.
When it comes to efficiency, it is the same thing – how a bank deploys capital to create more efficiently processes results in greater profit margins which creates more safety.
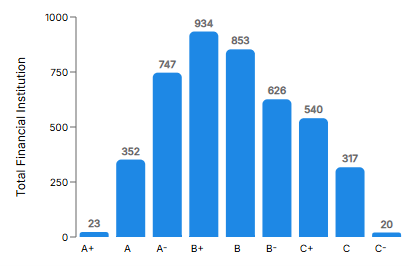
Distribution
By design, you can see banks fall into a normal distribution as illustrated below.
21% of the banks fall into the “B+” or “6” rated category, the highest concentration of banks. “B” rated banks (19%) and “A-“ rated banks (17%) are the next two most populated categories.
The Community Bank Opportunity
Banks can start by using this tool and then ask themselves, are they happy with the prediction? If the answer is no, then they can change their asset-liability mix, loan pricing, capital allocation or other metrics to change to better outcomes.
What business lines can you start or invest more that that will give you above average returns consistently? What business lines eat capital, and should you reduce your investment?
Consider board presentations. Instead of: “We believe our expansion strategy will succeed,” banks can present: “Based on our predictability status, here’s where we’ll rank among all US banks 18 months post-completion, with ±0.26 point confidence intervals keeping our current strategy”
Conversely, banks that are not happy with their standing can strategically look for ways to improve performance with the goal of producing above their cost of capital as a minimum target. This is the essence of our Fall Performance Series (HERE) where we provide a concrete path to improve profitability and bank health performance.
This isn’t about hope or guessing how your bank will perform 18 months from now, but strategic intelligence to help you shape your future.
The research validates what experienced bankers observe: banks that focus on sustainable returns, efficient asset deployment, and operational efficiency discipline consistently outperform peers. This tool codifies what works in community banking, then predicts how those fundamentals translate to a competitive advantage over time.
Putting This into Action
Community banking is becoming more data-driven, more competitive, and more strategic. Banks that embrace validated competitive intelligence will make better decisions than those relying on historical analysis and market assumptions.
For community banks serious about strategic planning, this represents a meaningful advancement in competitive intelligence capabilities. The real question is whether banks will leverage 18-month forecasting accuracy or continue planning with quarterly horizons.
That’s always been the difference between banks that shape their markets and banks that react to them.
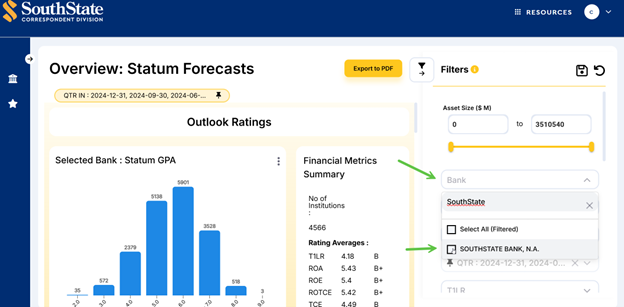
Getting Access to Check Your Bank Health Performance Score
If you are a domestic community bank, you can access the “Health Prediction” HERE for free on our Correspondent Bank “Resource Center.” If you do not already have a log in, you can register at the bottom of the page to gain free access to this application and several other resources.
Choose the current quarter (or you can see the history of rankings) and search for your bank, then choose your bank name from the drop-down menu.