How Variable-Rate Lending Shapes Bank Profitability [Study]

Few questions matter more to a community bank than how its earnings respond when interest rates move. Yet little research has been published to answer this question or how variable-rate lending contribute to risk and profitability. A recent study in 2026 by James W. Kolari, Ivan Pastor Sanz, and Wei Liu (ssrn-6898599) tackles that gap head-on, reconstructing each bank’s variable-rate loan share and then tracing how that ratio is related to net interest margin (NIM) and return on assets (ROA). For community banks, defined here as institutions with under $10 billion in assets, the findings are both encouraging and cautionary.
Analysis of Variable-Rate Lending
Every banker understands intuitively that floating-rate loans behave very differently from fixed-rate loans when the Federal Reserve moves interest rates. This study observed quarterly data and measured the relationship for every bank in the country (we will focus on the results for community banks). The authors applied their observations to all U.S. commercial banks from 2002 to 2024 – between roughly 3,700 and 4,500 banks a year. The average variable-rate loan share is about 13 percent, with wide variation across institutions.
Central Findings
The authors’ regression includes the lagged prime rate, the variable-rate loan share (labeled “Ratio”) and, crucially, the interaction of the two, all with bank-level fixed effects to strip out differences between institutions. Across nearly every period studied the authors conclude a positive and highly significant, with t-statistics between 3 and 9, relationship between the percentage of variable-rate loans and profitability. When rates climb, a bank with more floating-rate loans can reprice a larger slice of its portfolio quickly, lifting loan income faster than deposit costs rise and widening the margin. A bank holding mostly fixed-rate loans cannot. However, in a declining interest period one would expect that banks with more fixed-rate loans would outperform the market. However, it is not surprising to us, this is not the case (more on this below).
The authors divided their results based on bank size, and we will focus on this relationship for community banks. The relationship between variable-rate loan ratio and performance is large and significant in every rising- or recovering-rate period: roughly 2002–2007, 2008–2010 financial crisis, 2011–2019 recovery, and the 2022–2024 tightening. Figure 1 shows what those numbers mean – the marginal effect of a one-point rate increase on NIM, drawn across the range of variable-rate shares community banks hold, for each subperiod.
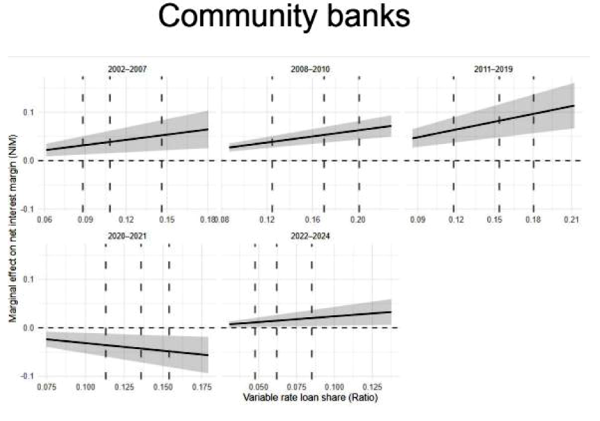
Figure 1. Marginal effect of a rise in the prime rate on community-bank net interest margins, by variable-rate loan share, across interest-rate regimes. Dashed lines mark the 25th, 50th, and 75th percentiles of the share. In every rising-rate period the line slopes upward and sits above zero — more variable-rate exposure means a bigger margin boost when rates rise.
The upward slopes tell the story. In each expansion or tightening period, a community bank with a richer mix of variable-rate loans enjoys a markedly stronger margin response to rate increases. The lone exception is the 2020–2021 pandemic panel, where the line slopes downward.
The one place the relationship breaks is 2020–2021. During those quarters, the Federal Reserve pinned short-term rates near zero and flooded the bank system with large supply of liquidity. Those interventions severed the normal link between rates, loan mix, and margins, which is why the NIM interaction turns negative for that window alone. Tellingly, the ROA relationship stayed positive even then, a sign that the pandemic distortion hit reported spreads more than overall returns. The graph below shows the analysis of variable-rate loan ratio to ROA for community banks.
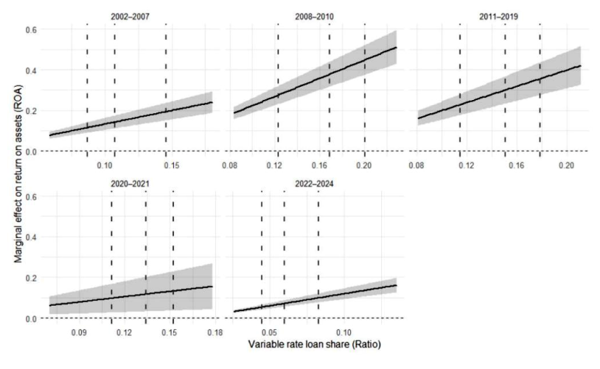
Figure 2. Marginal effect of a rise in the prime rate on ROA, by variable-rate loan share, across regimes (full sample, which is more than 96 percent community banks by count). Every panel slopes upward and stays above zero, including 2020–2021.
The above graph shows that the natural objection: that 1) floating-rate loans, while good for margins, may simply shift the pain elsewhere and when rates rise, borrowers face higher payments and some default, and 2) when rates fall, fixed-rate loans outperform, does not hold true. If variable-rate lending merely trades interest-rate risk for credit risk, the margin gains could be an illusion.
The ROA results shown above are stronger than the NIM results. The marginal effect of rate increases on ROA rises steadily with the variable-rate share in every single subperiod – and, unlike the NIM result, it stays positive even through the pandemic.
The clear, near-linear climb in Figure 3 below is the paper’s most reassuring result for community banks. Even after accounting for the credit losses that higher rates can trigger, and the perceived advantage of fixed-rate loans in a declining interest rate environment, the income gains from variable-rate lending more than pay for themselves. That is why the authors conclude that variable-rate lending tends to raise bank profitability on net.
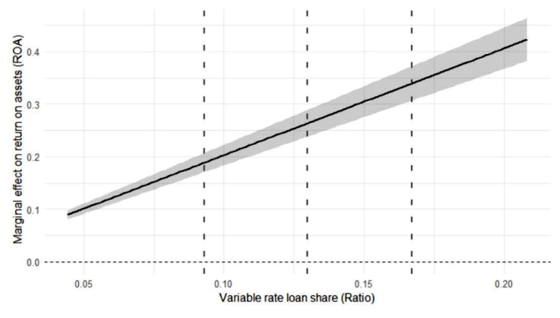
Figure 3. The pooled relationship: across the full period, the marginal ROA benefit of a rate increase climbs roughly linearly with a bank’s variable-rate share — from near 0.1 at low shares to above 0.4 at high shares.
What Community Banks Must Do To Maximize NIM and ROA
The study is descriptive rather than prescriptive, but the implications for a community bank trying to maximize margin and return are direct.
Lean into repricing power. The single clearest lever in the data is the variable-rate share. With the average community bank holding only about 13 percent of its book in floating-rate loans, most community banks have substantial room to raise that share. National banks by contrast hold 55 percent of their book in floating-rate loans.
Banks cannot manage the timing. While the benefit of variable-rate loans is largest precisely when rates are rising, no banker can time the market. However, near-zero interest rate environments (like the one during the pandemic) are rare. A bank should build floating-rate capacity rather than chasing it after the fact, while recognizing that policy shocks like the pandemic can temporarily upend the usual math.
Underwrite for the downside. The reason ROA (not just NIM) improves with variable-rate exposure is that, on average, many fixed-rate loans prepay when interest rates decline, but those same fixed-rate loans extend duration when interest rates rise, leaving community banks with only the downside risk.
Hedge the credit and interest rate risk on commercial loans. Shifting toward floating-rate loans moves interest-rate risk off the bank’s own balance sheet, but it can push that risk onto borrowers, whose payments climb when rates rise – the very channel that can drive up defaults. Commercial loan hedging lets a bank capture the floating-rate economics the study rewards while neutralizing that downside. In a commercial loan, the borrower gets the certainty of a fixed rate – reducing payment shock and the odds of default – and the bank keeps a variable-rate asset whose yield moves with interest rates, preserving the NIM and ROA gains documented above.
Treat the loan mix as an asset-liability decision. The whole mechanism depends on loans repricing faster than funding costs. Pairing a growing floating-rate book with a stable, low-cost deposit base is what converts variable-rate loans into durable margin and return rather than a temporary blip.