Customer Experience – How Service Focused Banks Measure Their Performance

While every bank talks about delivering on their service promise, only about 35% of banks have a formal effort and track key performance indicators (KPI). It is no surprise that these banks not only have higher customer experience performance but have a higher return on equity numbers. A better customer experience means less churn, a longer account life, more repurchases, more cross-sell, lower operating cost, greater trust, and more forgiveness. In short, it means a more significant cumulative lifetime value. In this article, we rank the top metrics used by banks and how to improve both the customer experience and profitability.
The State of the Industry for Customer Experience
By our estimation, most banks don’t have a formal program for improving the customer experience. They may talk about it and even do the occasional customer survey, but there is no codified effort to improve it.
However, around 30% to 40% of banks do have a formal effort by our estimation. A recent survey of organizations that focus on improving customer service and the customer experience yielded the below ranking of metrics where respondents could choose multiple metrics they track.
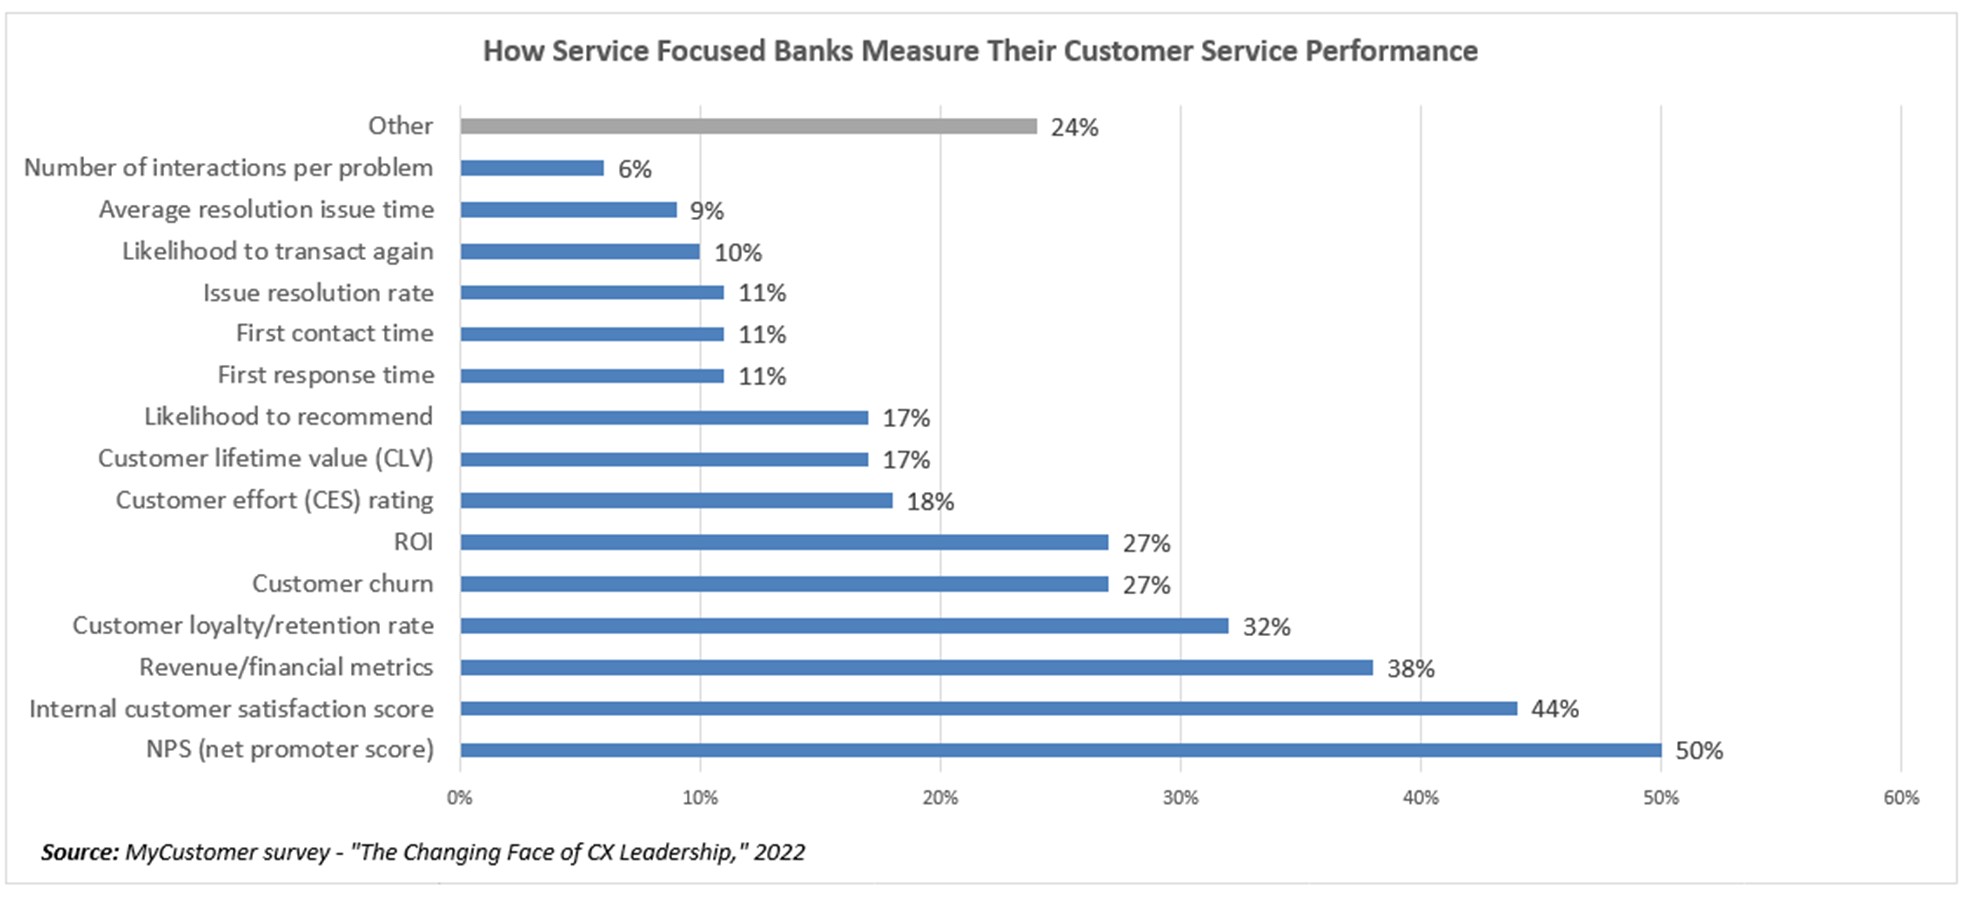
Let’s break down these metrics in order of their popularity.
Customer Experience Metrics That Matter – Net Promoter Score (NPS)
While we are not huge fans of the Net Promotor Score, it does have its place. About half the banks that are focused on formally improving the customer experience use it.
NPS primarily comes down to a single question – On a scale of zero to ten, how likely are you to recommend our bank? Suppose a customer scores a zero to six. In that case, they are a “Detractor,” if they score seven or eight, they are “Passives” and not likely to say anything positive or negative about the bank, and if they score a nine or ten, then they are a “Promoter” and likely to say positive things about the bank.
The strength is that NPS is a simple way to understand customer sentiment that all employees can understand. The problem with NPS is that it is oversimplified. A customer can be both a promotor or a detractor, depending on the circumstances. You may love a free checking product for someone just coming out of college but hate the free checking account for yourself. Also, you might like the bank because they are nice to you but do not like their hours or their fees. Twitter is the classic example of a company that has a low NPS score and high detractors, but one that often gets recommended.
Despite its shortcomings, NPS can be helpful, and many banks are fans. One significant advantage is that there is enough published information that banks can readily compare their NPS performance. HERE you can see the annual NPS scores for both banks and fintechs.
According to a 2021 Qualtrics report, the average bank has an NPS of 19, which compares favorably to the average NPS in corporate America, at a 12. A bank can quantitatively move the needle in customer experience by focusing on improving NPS, like the graphical example below. Here, a bank started with a -10 NPS score and moved to a 50 by increasing the number of Promoters through improving their mobile banking app, better customer problem resolution, more communication, and the act of measuring.
![]()
Customer Satisfaction Score (CSat)
Next to NPS, the second most common metric is internally derived around satisfaction. You get one of those surveys based on a Likert scale after an interaction such as a loan closing, account opening, or problem resolution. A “5” means that you are “Extremely Satisfied,” a “4” means you are “Moderately Satisfied,” and so on.
The major advantage to a customer satisfaction score is that while NPS tends to measure the brand strength of the bank, a CSat metric can be used at the product or event level. Some banks combine the CSat metric with an NPS concept and utilize a “likeliness to recommend” or “likeliness to transaction again” in a survey after a transaction.
Revenue/Profitability/Financial Metrics
If you polled all the banks in the industry and not just the ones that have formal programs, a set of financial metrics would be the most common. While it all comes down to product revenue, profitability, and, our favorite, cumulative lifetime value, financial metrics are not real actionable and instructive if your goal is to make the customer happy.
This is always a good test if your bank’s heart is truly in the total experience game (HERE) or not. You either believe that profit is the most important metric to focus on or that total experience for both the customer and employee is most important, and profit will come as a byproduct. While these two philosophical strategies can lead you down the same path, it usually does not.
Customer Churn
We believe that calculating some derivation of customer churn, retention, or attrition is critical for the bank at all levels – product and brand. If you are serious about cumulative lifetime value and the total experience, then churn is a crucial metric on your dashboard.
In this age of data, there are hundreds of items that a bank can track that may be a predictor of customer churn at your shop. It might be a problem that is taking too long to resolve; it might be a declined loan, a particular ACH payment, or a dramatic reduction in deposit balances. Understanding what drives churn and the levers you have to slow churn is likely the one metric that is most sensitive to input that also has the most significant impact on long-term profitability.
If you do not see at least a monthly report on churn, nothing else in this article likely matters. Start with churn and build from there.
Problem Resolution
Some banks have a whole set of KPIs around problem resolution. As can be seen, from the above chart, the number of interactions it takes to resolve a problem, the average time to fix a problem, first response time, and time to first contact are all common, with about 10% of banks using those metrics.
We discussed the top problems that banks have and the best practices towards problem resolution recently HERE.
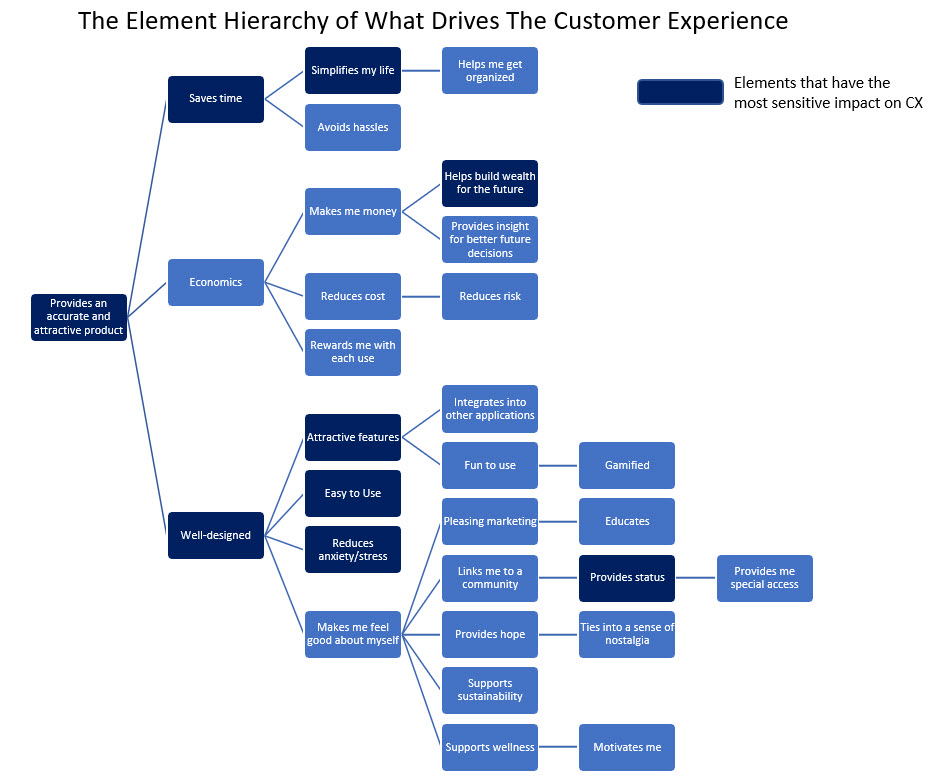
Focusing on the Customer Experience Metrics That Matter
If your bank is looking to improve customer experience, we recommend tracking customer churn, CSat metrics (or NPS), problem resolution statistics, and your financial metrics. Then below, we charted a “cheat sheet” of the elements that we have found to make a difference in improving the customer experience. Those items in the dark blue tend to have the most sensitivity. Thus, it would help if you started there or prioritized fulfilling those elements in a customer journey.