How to Mange Community Bank Loan Competitors

For any business to succeed, managers need to understand their competitive landscape. What the competition is offering, delivery channels, pricing methods, and service levels helps community banks differentiate their offering and enhance their competitive advantage. Unfortunately, the competitive analysis for the broadly defined banking industry is challenging to understand because of the rapid innovation in certain sectors and long-term decline of certain competitors. In this article, we want to highlight community bank loan competitors, why bankers should define their competition broadly and how they should position their business for long-term profitability.
Who are Your Bank Loan Competitors?
Many community bankers understand that every lender and deposit taker is a competitor. Even if your average client may not consider doing business with Bank of America or Truist, your most profitable clients are being courted or influenced by these banks. There are a couple of important principles to understand: first, the banking industry is rapidly consolidating, and second, most community bank’s profitability is generated by a small percentage of customers.
Rapid Consolidation
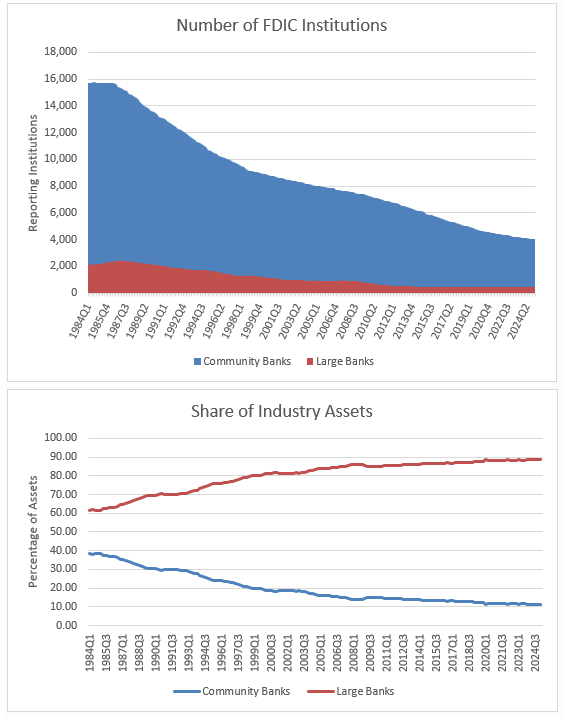
The two graphs below show the number of FDIC charters divided between community banks (under $10Bn in assets) and large banks (over $10Bn in assets), and the total assets controlled by each group. The key takeaway is that since 1984 the number of community banks has been declining rapidly (about 350 to 400 community banks per year disappear), and the share of assets held by community banks is declining even more rapidly. Community banks now hold just 11% of all bank assets in the country.
Client Profitability
Industry analysis reaffirms that the vast majority of community bank profitability is generated by less than 10% of bank clients. The graph below shows a typical distribution of bank relationships. The clients on the left side are highly profitable, the clients on the right side are highly unprofitable, and the clients in the middle of the graph contribute little to profitability.
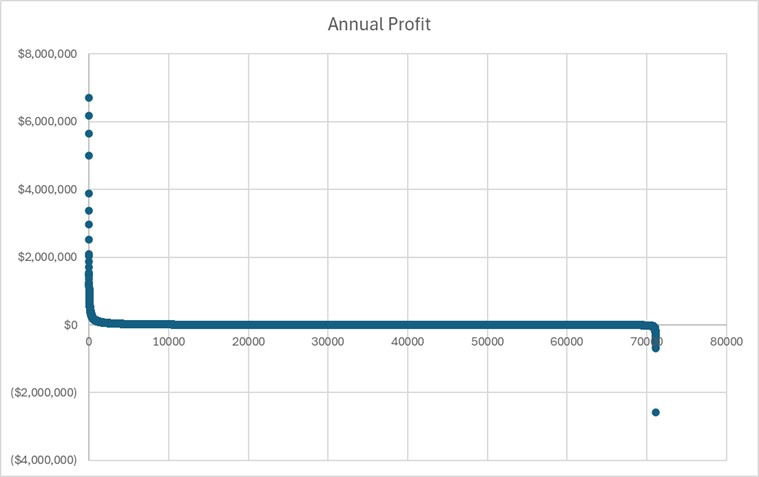
In our recent bank analysis, we found that 7.56% of all clients accounted for 80% of the entire bank’s profits and 48% of all clients generated close to zero or negative profits for the bank. Most banks could shed 90% of their least profitable clients and generate about the same profitability.
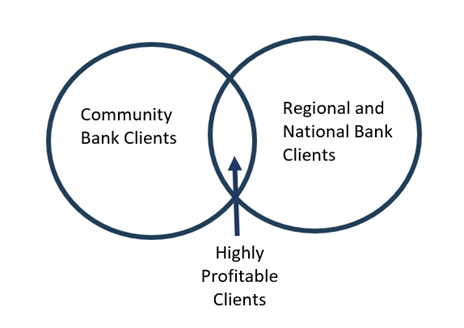
While a majority of banks compete vigorously for every client, just a small percentage of clients are the main driver of profitability – these are the clients targeted by regional and national banks. The graph below shows that the competition for customers is de facto the goal to retain and attract the few highly profitable clients that drive ROA/ROE performance.
The Landscape of Bank Loan Competitors
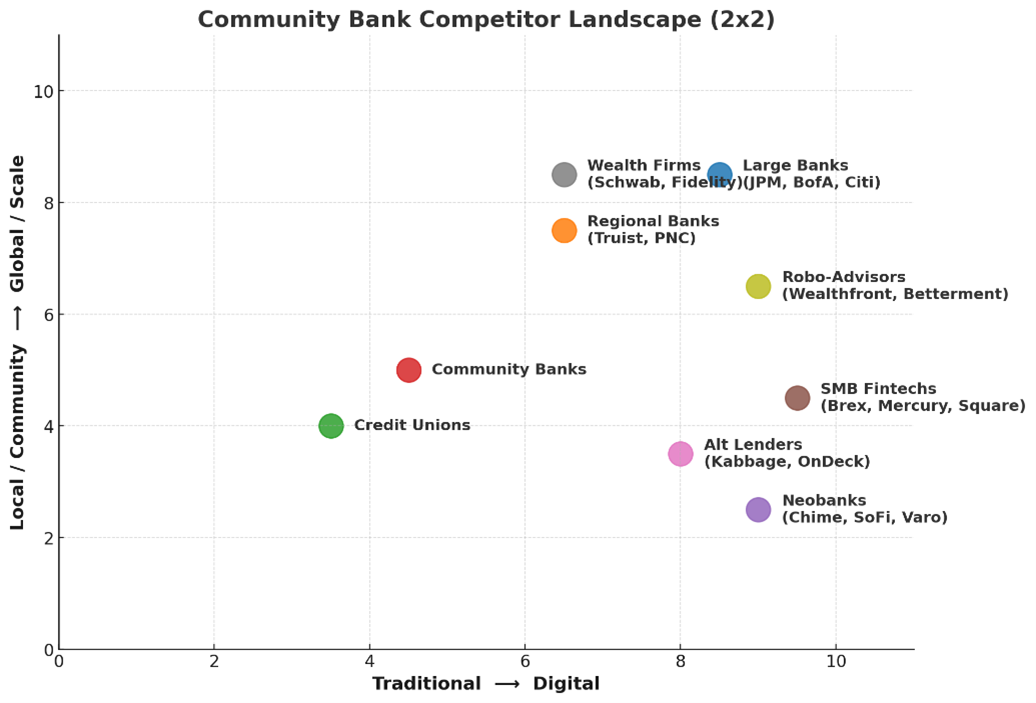
Of course the competition for community bank clients is not just larger banks. Credit unions, fintechs, wealth firms, and others are equally interested in landing the small percentage of highly profitable accounts. The graph below shows the community bank competitor landscape by geography focus and digital delivery. Each competitor group is aiming to identify, and retain or attract the small percentage of profitable clients.
Action Items for Community Banks
There are many deposit and bank loan competitors. The key for community banks is to be able to measure and identify profitable clients, products, regions, and portfolios so that profitable clients are retained, and unprofitable ones can be cross-sold, upsold, or transitioned to competitors. Measuring ongoing profitability is key so that relationship managers can focus on retaining the coveted accounts and cross-sell and upsell to the less profitable clients.
Community banks are no longer just competing with just local competitors. The banking industry is nationwide and is becoming less branch focused. Further, the competition is not just another bank that might make a loan or take a deposit, but it could be a credit union, insurance company, retail store, or a fintech.
Many of the largest banks in the country consider themselves IT companies that manage and measure profitability and maintain relationships. While community banks cannot match software companies or larger banks in spending and IT development, community banks also have talent and can evolve and buy off-the-shelf technology that allows them to compete more effectively. More importantly they can use their small size to their advantage and move faster with innovation.
Community banks do not need to mirror the larger banks in their services, price, or delivery channels. However, community banks should consider implementing the following management tools (all used by their competitors) because they are easy to adopt and can gain community banks significant advantages:
- RAROC – most competitors measure product profitability with risk-adjusted return on capital models. Loans, deposits, fee services, branches, product lines, and relationships can all be measured using a RAROC model, allowing for better capital allocation, product development decisions, and product pricing.
- FTP – larger banks, as a rule, deploy funds transfer pricing in RAROC measurements. This tool allows banks to understand the profitability contribution from various units and products. FTP allows banks to allocate profit to branch deposits, loan pricing, liquidity premium, duration risk, and optionality.
- SVA – many competitors consider shareholder value-added pricing, which considers operating profits produced over that firm’s cost of capital. This helps firms understand the importance of size and scale to profitability. Community banks may still want to make smaller-sized loans, but understanding the impact on SVA helps banks determine how much of that business they want to do and at what cost.
Remember that each one of your competitors would gladly have your best customer – just the customer you want to keep.