
How to Leverage Branch Traffic to Build Savings Volume

If there is one underutilized bank product that can build value, it is the savings account. Most banks not only woefully neglect marketing and developing the savings account but fail to invest the energy in understanding its strategic importance. In the same vein, branch traffic is an underutilized value. In this article, we explore how to build savings account value by leveraging branch traffic while educating bankers around the quantification of the upsell.
The Strategic Value Of The Savings Account
Most banks make little distinction between the savings account and money market account for their retail and commercial customers. Not wanting to take the time to understand the difference, most customers gravitate towards the higher rate account. While this works for some banks, it is not optimized.
While we detailed our recommendations on deposit account restructuring HERE, the takeaway is that banks should position their money market accounts for intermediate term savings and their savings accounts for longer term savings. This often means refining the rate and account features but by positioning the accounts in this way banks increase the deposit performance on not only both accounts but on their transaction and CD accounts as well.
The Underutilization of The Branch
Another issue with most banks is that they underappreciate the power of their branch. This is ironic given the outsize level of capital devoted to the branch network. For example. few banks segment their customer base between branch users and non-branch customers. In many banks, these two customer types behave differently, have different sensitivities and have a different brand relationship.
In all probability, customers who regularly visit the branch are influenced by its geographic proximity, value the convenience it offers, and prefer in-person interaction.
By using data, we are going to walk through a campaign that takes advantage of branch traffic while promoting the savings account to build balances and increase deposit performance.
Cross and Upsell Relationships
For this analysis, we look at the frequency of branch visits and see if the customer already has a savings account. The behavioral concept here is that a customer is more likely to add balances to their existing account than open a new account. Further, the customer who uses the branch is more likely tied to that geographical area and has solid physical alignment with the branch if they use it frequently.
We then turn to the data to look at the relationship between branch visits and propensity to add to their savings account.
While you can use AI to simulate your deposit base like we discussed HERE, you can also model the data using the logistic regression function in Excel.
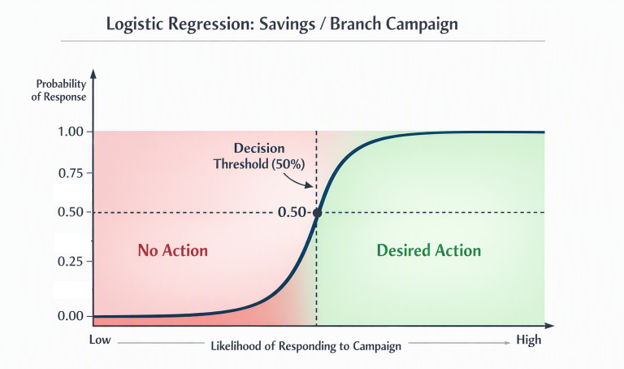
What you get is a set of bounded probabilities that show the relationship between branch and a new savings function. As predicted, these probabilities produce a standard bell-shaped curve also represented by the “S” or sigmoid curve below.
Using the Data for a “Community First” Deposit Campaign
One of our favorite deposit campaigns is simple and never seems to fail – a pledge to reinvest all the gathered deposits back into the local community. Chances are you are doing this anyway. Chances are that you are not marketing the significance of this campaign.
To make this campaign effective, you start with marketing to frequent branch visitors that already have accounts. The coefficients and odds are below.
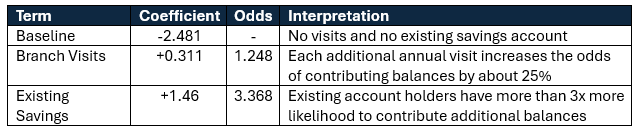
Understanding the odds on one customer is useful, but the real power of this is turning this into a campaign.
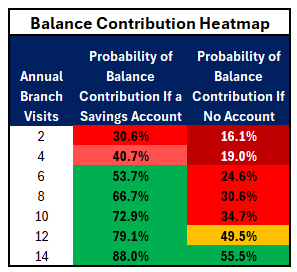
We can create a targeted matrix to make decisions for every customer at scale. The below probabilities result in understandable actionable intelligence from the data. If a customer has more than a 50% probability, send or make the offer to contribute savings balances to help put capital into the community. If they are below 50%, hold off on the offer to not wear the customer out with needless promotions.
Before You Act on the Numbers
Of course, this is just a sample bank, and your customers may react differently (although likely not much differently). Banks should also test their modeled data. For the methodology above, you can verify the data using a chi-square test where a p-value below 0.05 is a typical threshold where you can proceed with confidence when it comes to bank marketing.
We will also point out that the 50% threshold that we imposed was somewhat arbitrary and was set based on how the data presented itself and that fact that any mistake is relatively modest. The more expensive your campaign is or the more you think your customers will get annoyed by excess marketing, the higher your threshold should be. Conversely, if you desperately need deposits, then a missed customer conversion is costlier, and you may want to consider a threshold of 30% given the data above.
We will also add that this deposit analysis was gathered in a period of stable and rising rates. As rates move, sentiment changes and bank branding/marketing ebbs and flows, the above relationships will change.
Effective risk management requires the ongoing monitoring of models.
Putting This Into Action
While we talk a lot about machined learned models in this age of AI, we wanted to highlight a trusted deposit data methodology that has been used for decades, can be done on an Excel spreadsheet and has still stood the test of time for its accuracy. A logistic regression model has the advantage of being transparent, interpretable, testable and defensible in ways deep learning cannot be.
The substantive takeaway here outside of data is that your branch traffic and savings account hold the keys to larger balances. Market a community first account to frequent customers and see how you can build lower rate sensitive deposit balances.