The Growing Concern With Your Cost of Funds

The banking industry’s cost of funds (COF) is highly correlated to short-term interest rates. However, as of Q2/22, the average community bank’s COF has risen only a few basis points. Community banks should be concerned about their COF because looking at current deposit conditions is like driving a car while looking at the rearview mirror. The changes in the road are ahead and not behind the driver.
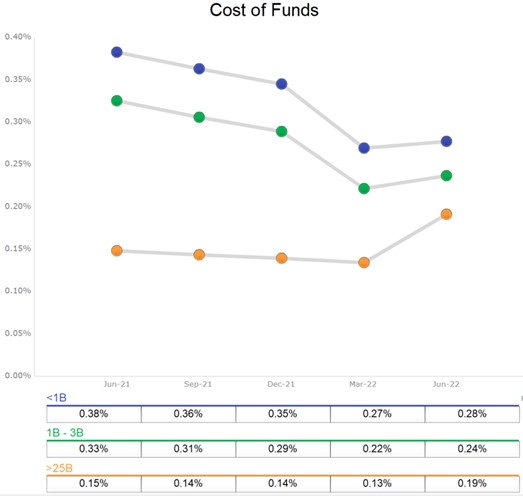
The Data on Cost of Funds
The COF over the past five quarters is shown for three asset peer groups: banks under $1B (3.5k banks), $1-$3B (567 banks), and greater than $25B (81 banks). While community banks saw COF increase by an average of just two basis points in Q2/22, the COF at larger banks increased by six basis points to 0.19%.
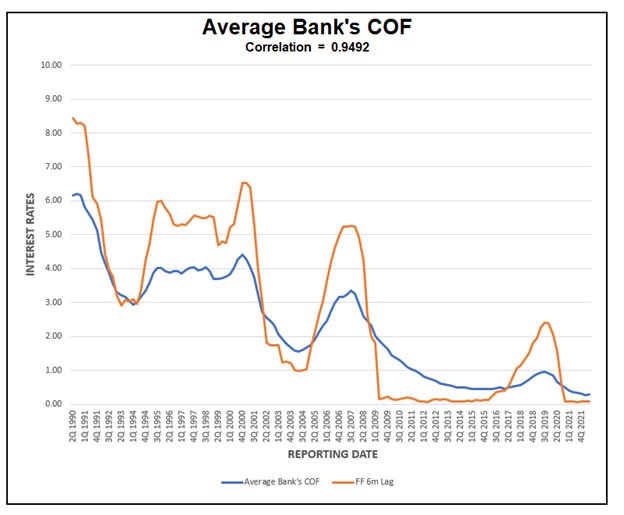
Many bankers see the data above as innocuous, but we need to understand what this portends for the industry. We examine all FDIC-insured commercial banks and S&L associations over the last three decades and plot COF versus short-term rates. Financial institutions’ COF behavior is similar across asset sizes. The correlation coefficient between the industry’s COF and short-term rates (LIBOR, Prime, SOFR, Fed Funds) is in the mid-90s. Most importantly, the industry’s lag between short-term rates and COF has historically been approximately six months.
Below is a graph showing the average bank’s COF (non-size weighted) versus Fed Funds with a six-month lag. The correlation coefficient is almost 0.95 using that six-month lag.
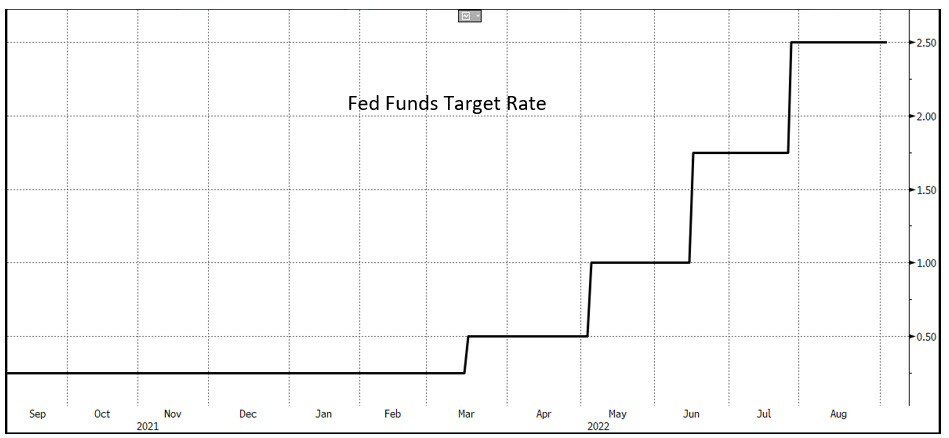
While COF moved very little for community banks for Q2, using a six-month lag, or lookback, Fed Funds did not move at all six months ago. Below is a graph of the Fed Funds target rate for the last year.
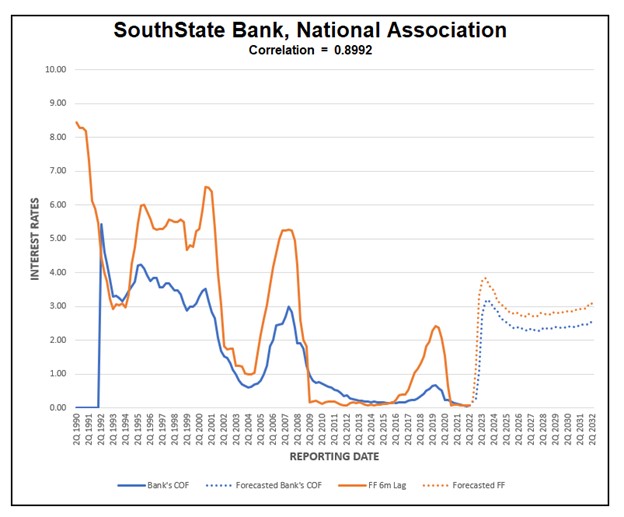
At SouthState Bank, we also study our COF as it is correlated with Fed Funds. We note that our COF correlation to Fed Funds is almost 0.90, and we also plot Fed Fund future rates and project our COF with a six-month lag. That graph appears below.
Fed Funds first increased by 25bps on March 16th and again in May, June, and July. Community banks will feel the effects of these hikes over the next few quarters.
Differences In This Hiking Cycle
Historically, bank deposit betas ranged between the low-20s and mid-50s, depending on the length of the hiking cycle, the magnitude of total hikes, the size of each increase, and balance sheet changes at the Fed.
Online Banks:
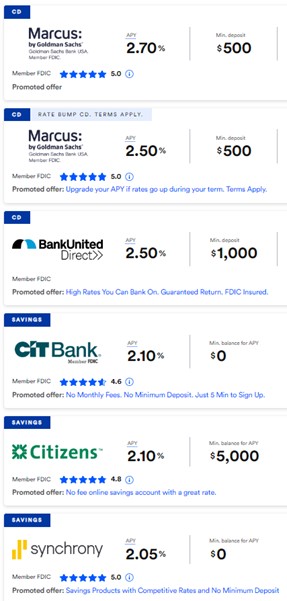
Online banks with consumer relationships will likely increase the industry’s deposit betas in this hiking cycle. Online banks like American Express, Capital One, Marcus (Goldman Sachs), Ally Bank, and others hold about 10% of domestic deposits. These online banks have much higher betas (American Express Bank at over 73%, and Marcus at 77%, as an example in the last tightening cycle). We expect these institutions to increase the industry’s COF faster. Below are some examples of the current rates offered by some online lenders in early September.
Magnitude and Length of Hikes:
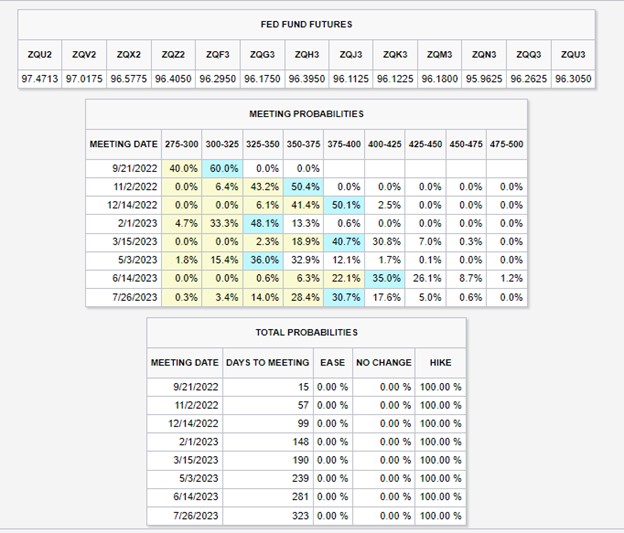
The Fed has raised interest rates four times this year so far. The last two hikes were 75bps, and the market expects another 75bps in September. The market also expects Fed Funds to reach 4.00% and stay there through 2023, as shown by the tables below (CME FedWatch Tool). These higher rates will put direct pressure on the cost of funds at banks.
Larger magnitude hikes, for a more extended period, that causes Fed Funds to stay higher for longer, have a higher proportional impact on the industry’s COF. Again, that impact has historically had a 6-month lag.
Quantitative Tightening:
In this cycle, the Fed announced quantitative tightening at $95Bn/mo, and this pace is expected to remove almost all banks’ excess deposits in 2024. The graph below shows the Fed’s balance sheet over time and the projected reduction through 2024.
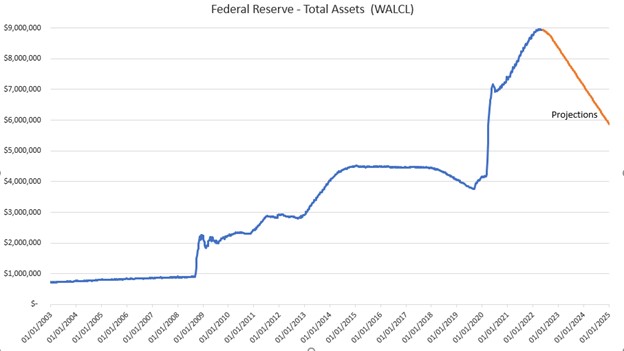
The current projection is that the Fed will remove $3T assets by the end of 2024. The OCC published in January 2022 that the banking system currently holds $3T in “excess” deposits (about 17% of total deposits). Every dollar reduction in the Fed’s balance sheet reduces the reserves that banks hold at the Fed. That, in turn, reduces deposits at banks by the same amount and puts upward pressure on the cost of funds. The counterargument is that opportunities for higher returns in similar low-risk, liquid vehicles such as Treasuries and commercial paper (held in money market funds) are not available, and consumers and commercial accounts are willing to park funds in bank deposit accounts. However, Treasuries and money market funds are already yielding at or above 3.00% and are becoming a safe and attractive alternative for depositors.
How to Apply to Your Bank
We believe that the industry’s average beta will be higher in this hiking cycle than in the previous two cycles. Higher beta means more significant cost of funds sensitivity. Still, the impact of rising interest rates and a shrinking Fed balance sheet will be felt by community banks later this year and next. Each community bank should understand its COF correlation to short-term rates and the deposit beta through the last hiking cycles. Let us know if you want us to run and share this analysis for your institution.