How The Fed Will Impact Your Deposit Beta
Your bank’s deposit beta is going to rapidly change. In our previous article (HERE), we reviewed the banking industry’s cost of funding earning assets (COF), and we compared how community banks’ COF behaves relative to national banks in a rising interest rate cycle. We showed that the average community bank’s COF is highly correlated to short-term interest rates – in the mid 90’s for a correlation coefficient with a 6-month lag. We also considered how the Federal Reserve’s fight against inflation would change short-term interest rates and reduce the Fed’s $9Tn balance sheet. In this article, we further discuss how the expected monetary policy changes will affect the industry in the next few years, specifically community banks’ deposit betas.
Influences on Deposit Beta
The following external factors would amplify the industry’s beta:
- Higher pace of rate hikes – The faster interest rates move, the more pressure banks face increasing rates to retain deposits. The Fed is data-dependent but has reinforced the market’s view of front-end loading interest rates at 50bps per meeting. This is a rapid pace by historical standards. The Fed has not raised interest rates by 50bps since 2000. Consumers especially notice the pace of interest rate hikes and become more sensitive to higher speed of increases.
- Starting point is important – Depositors would normally care little if they earn zero or a few basis points on their balances (especially if those balances are small). But those same depositors do value the earning potential as interest rates are higher. This interest rate cycle is starting at a low level.
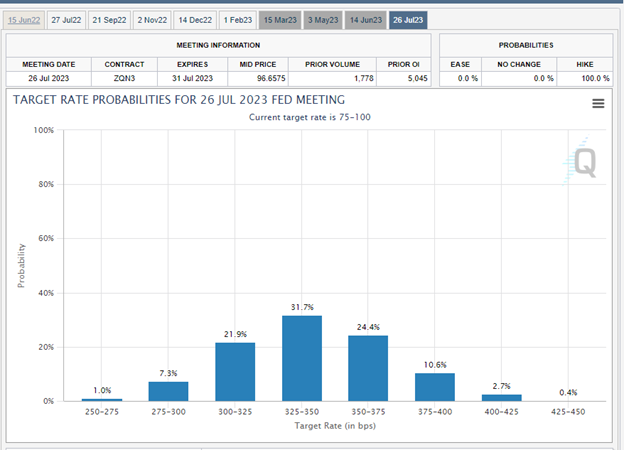
- Terminal rate – The higher the terminal Fed Funds rate, the higher the beta. We have no way of knowing the exact future path of short-term interest rates, but the graph below from the CME Group (HERE for updates) shows the market’s expectation of the target Fed Funds rate for the July 2023 meeting is 3.25 – 3.50%. The future expected path of interest rates has been rising consistently for the last six months. What was a single 25bp rate hike turned into four, 25bps rate hikes, then six and now 13.

The following external factors would dampen the industry’s beta:
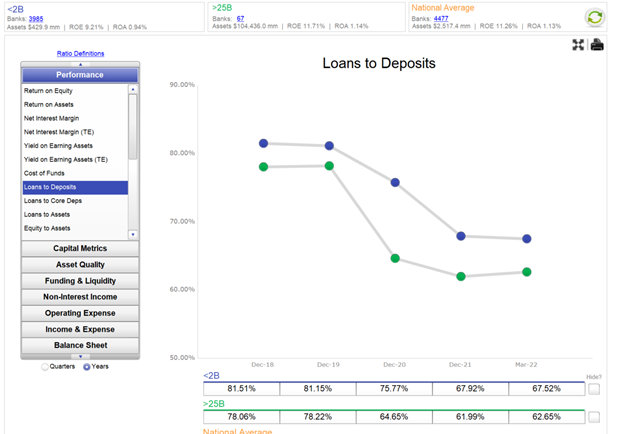
- Ample liquidity – Banks are flush with liquidity and can lag the market with deposit rate increases. Most banks do not need to pay higher deposit rates to retain liquidity. As shown in the graph below, loan-to-deposit ratios for banks under $2Bn in assets have fallen 13.6 percentage points to 67.52% from the end of 2019 to the end of 2021. Total domestic deposits in the banking industry have increased by $4.9T during that same time period, while noninterest-bearing deposits have increased by $2.3T from 2019 to 2021.

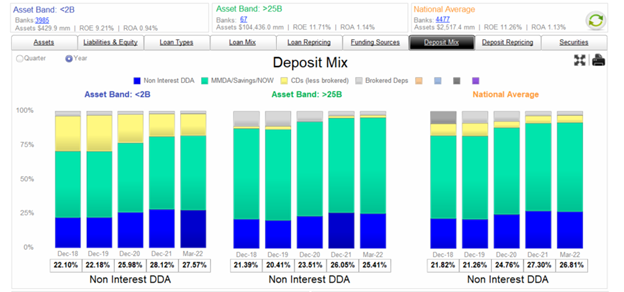
- Higher DDA mix – Shifting from brokered deposits, CDs, and MMDA to DDA helps banks lower their beta. As shown in the graph below, the industry has successfully increased DDA balances by approximately five percentage points from 2019 to 2021. Smaller banks (under $2B in assets) still show a higher percentage of their deposit mix in CDs vs. larger banks. In contrast, larger banks (over $25Bn in assets) show a higher percentage of their deposit mix in brokered deposits vs. smaller banks.

Historical Deposit Betas During The Last Three Tightening Cycles
We looked at the last three Fed tightening cycles: Q3’99 to Q4’00, where the rates increased by 1.75%, Q3’04 to Q2’07, where rates increased by 4.25%, and Q1’16 to Q1’19 where rates increased by 2.25%. The beta for all banks, and various sized banks over the entire cycle is listed below.

There are a few key takeaways:
- Deposit beta for larger banks is higher but moving closer to the industry average.
- The 2016 to 2019 hiking cycle is unusual in a number of ways: it is slow-paced, relatively shallow, and was conducted after massive quantitative easing without commensurate quantitative tightening (more on this below).
It is hard to extrapolate the trend in deposit betas in time series over the last three rate cycles because of each cycle’s desperate circumstances. However, there appears to be a trend that beta is softening, especially for larger banks. Nonetheless, there are many caveats that we would like to underscore.
Caveats to Dampening Deposit Betas
First, we point out the difference between online banks with consumer relationships today versus the previous cycles. We calculate that online banks like American Express, Capital One, Marcus (Goldman Sachs), Ally Bank, and others hold a little over 9% of all domestic deposits. That 9% does not include specialty consumer banks or fintech companies. These online institutions were either absent or held minimal deposits in previous tightening cycles. These online banks have much higher betas (American Express Bank at over 73%, and Marcus at 77%, as an example in the last tightening cycle). We expect these institutions to increase the industry’s deposit beta in this hiking cycle.
Second, the market has priced in interest rate risk, but it has not priced liquidity risk. But the
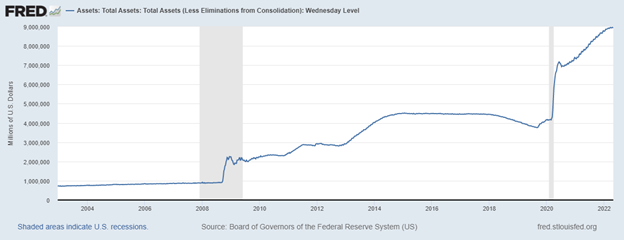
days of abundant liquidity are expected to be behind us. In the 2016 tightening cycle, the Fed started running off its balance sheet two years after its first rate hike. Further, its quantitative tightening was much smaller (at $50B/mo) than what was announced last week (at $95Bn/mo). Also, In the last cycle, it took a full year for the Fed to reach that maximum reduction rate of $50B/mo. The tightening process in this cycle is going to be faster and larger than in the previous cycle. The graph below shows the Fed’s balance sheet over time.

In the last tightening cycle, its total balance sheet was around $4.5T, and it took nearly two years to bring that down by about $650Bn before the Fed brought the program to a stop because of the pandemic. This time the Fed will go to $95B/mo within three months and achieve a balance sheet reduction of $1.1T per year. The Fed will surpass the total of the entire 2017-2019 balance sheet tightening by early 2023. The market anticipates about $3 trillion in total balance sheet reduction by the end of 2024.
Here is the liquidity risk, the Fed’s balance sheet reduction directly and linearly affects the banking system’s liquidity. As we wrote in the last blog, every dollar reduction in the Fed’s balance sheet reduces the reserves that banks hold at the Fed. That, in turn, reduces deposits at banks by the same amount. Since the start of the pandemic, total noninterest-bearing deposits have increased by $2.3T, and we would expect the Fed quantitative tightening to draw most of that excess liquidity out of the banking system within the next two years. Therefore, we would expect industry beta to be closer to that seen in the 2004 to 2007 tightening cycle of 40% to 50%.
How to Apply to Your Bank
While the industry’s average deposit beta might be 40% to 50% in this hiking cycle, the impact of rising interest rates and a shrinking Fed balance sheet will be different for each community bank. Community banks with larger percentages of DDA balances will fare better. Those community banks that do not directly compete against national, regional or online lenders will also have lower betas.
Banks that have a high number of lower-balance consumer accounts will also achieve lower betas, and community banks that have been able to grow deposits with new accounts vs. increase in account balances are also poised to maintain lower betas. While the industry beta may be slightly higher in this hiking cycle than the last, each community bank has substantial influence over the strength of its deposit franchise. Community banks that are able to attract less price-sensitive consumers and operating business accounts will outperform the market.

