How This Sample Size Calculator Will Make You a Better Banker [Calculator]
A tool that every banker should have at their disposal is the ability to figure out what a statistically valid sample size is from a given population (calculator at the bottom). A simple everyday example is in the case where examiners are coming in and you want to be sure all your wires are BSA compliant. Do you have to check all of them, or can you accomplish the same analysis with less work and just take a sampling of the data? Maybe you want to know what your customers think and want to know how many surveys to email out. Or, you might want to test a marketing program and want to know how many to include in your test. In a more complicated example, maybe you are a Lean Six Sigma bank and you want to benchmark the accuracy and production time of your credit files. Understanding what a statistically valid sample is for each population is the key to working more productively and more accurately.
We have boiled down the math for you and have provided our sample calculator at the end of this article that we use almost daily somewhere in the bank. To understand the basic concepts, bankers need to know three things:
Population Size – this is your total universe of items you are trying to measure. It could be customers, potential customers, wires, employees, or the number of times people use your drive-up. Let’s say we wanted to test a particular group of customers in a commercial checking product to see their level of satisfaction. We start by looking in our core system and querying on this product to determine that there are 38,583 businesses in this product. This is our total population.

Confidence Level – Confidence level is the amount of accuracy you need your sample to reflect the population. In other words, it is how confident you are going to be in your statistics. If you need to be 100% accurate, then you might have to sample almost every business. However, this is rarely the case. The tradeoff of accuracy is resources. So, if you can take a little less accuracy, then you can save resources. For an inexpensive email campaign, we might only need to be 90% accurate. However, for a more expensive promotion, usually we need to be 95% accurate. In critical efforts, like maybe BSA, we might need to be 99% accurate. 99%, 95%, and 90% cover almost all of our cases over the past year (and that statement was 90% accurate). For our example of polling our business checking product, we will need to have 95% confidence.
The Margin of Error – This is the percentage that describes how closely your sample population is to the true value of the population. If the margin of error is 2, then the error is likely in the band of plus or minus 2%. Where confidence level tells you how accurate your sample output is compared to your population, your margin of error tells you how accurate any given single response is to the sample. It is helpful to understand that the population size doesn’t matter when calculating a margin of error. A very small sample size – say 50 has a 14% margin of error while a larger sample of 1,000 has a 3% error rate. The margin of error decreases as the sample size increases. For our example, we will use a margin of error of 3%.
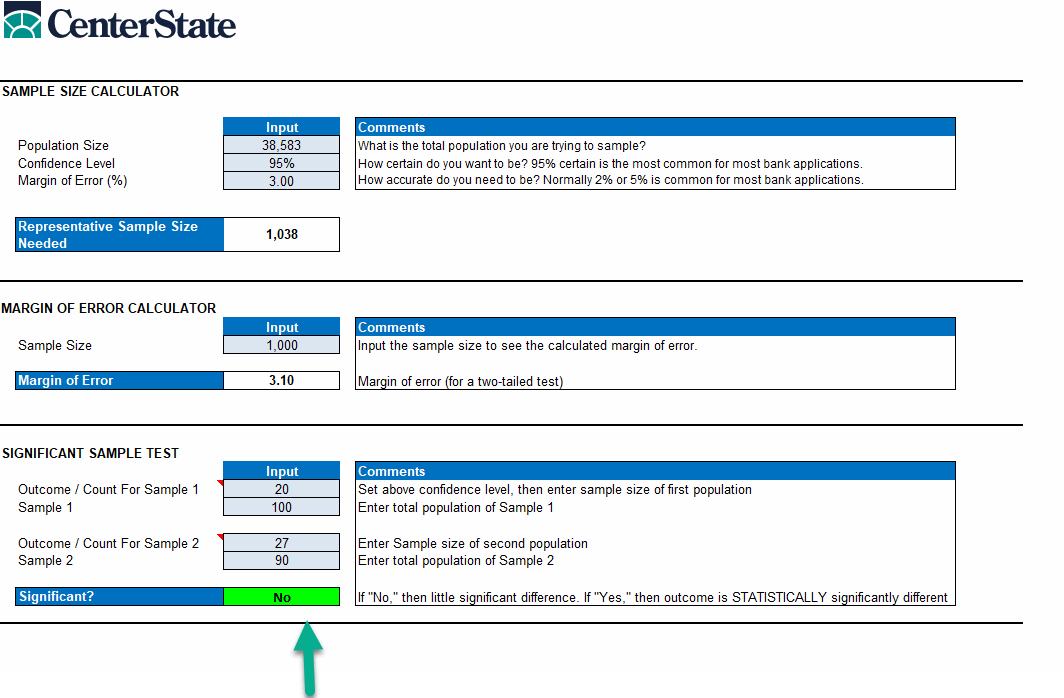
Inputting all the above into the calculator, we get that if we get responses back from 1,038 of our 38,583 commercial customers (2.7%), we are 95% sure that those responses will represent all of the target commercial checking customers plus or minus 3%.
Finally, there is one more related statistical tool that is helpful. When comparing two outcomes with different populations it is helpful to know if both results are statistically significant. This mostly comes up when testing a bank marketing offer. We send 100 emails to target customers and 20 want to open an IRA account. We then test another IRA offer to 90 customers and 27 want to open an IRA account. Without statistics, you would conclude that the second offer was better. While it might be better, statistically, there is little difference in the outcomes since the sampling had a wide margin of error. Using this calculation, we can conclude that there is no statistical significance.
If you are a financial institution, download our Sampling Calculator HERE and get the above three calculation tools in one spreadsheet to answer most of your sampling questions. This will give you the power of statistical sampling all in one place. Learning these statistical techniques will not only save you time but understanding and working with these concepts will make you a better banker.

