How National Banks Are Poaching Loans and Deposits
Last week we spoke to a $1.2B community bank management team. The CLO was lamenting how he was losing quality loans and deposits to three aggressive national banks in the territory. An example was a $1.95mm owner-occupied CRE loan, where the borrower had multiple operating accounts totaling almost $500k. While this community bank is not aggressively pricing new loans, losing this commercial credit with a substantial deposit relationship was painful. We looked at the term sheet offered by the national bank and pointed out the strategy that this national bank was deploying and how the community bank could respond.
National Bank Competition – A Specific Example
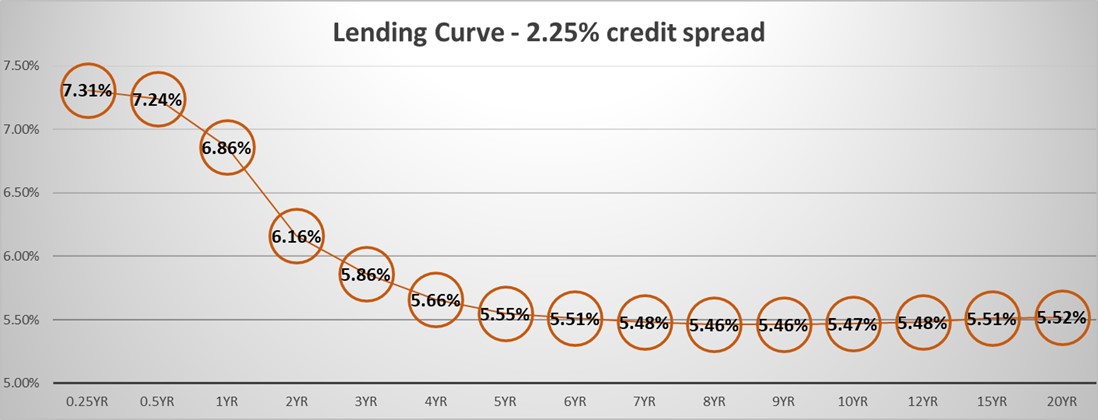
This community bank was pricing this specific loan at Prime rate minus 1.00%, and the operating accounts were demand deposit accounts (DDAs) with some additional fee income. The national bank issued a term sheet that offered the borrower a five, seven, and ten-year fixed rate loan at 5.55%, 5.48%, and 5.47%, respectively. Therefore, the borrower was offered a fixed-rate loan 1.75% lower than their current rate. The national bank was pricing the loan at 2.25% over SOFR, and we calculated that the national bank’s starting floating rate for this loan was 7.31%, or 6bps higher than the community bank’s current rate (Prime minus 1.00%, or 7.25%). How can the national bank obtain a higher floating rate (by 6bps) and still offer to lock the borrower’s loan rate at 1.75% lower than the current loan coupon? The answer is that the national bank uses the current yield curve and loan hedging program to its advantage.
The Yield Curve
The graph below shows the lending curve from three months to 20 years and demonstrates commercial loan rates for different repricing terms corresponding to SOFR plus 2.25% (the spread offered to the borrower in our example). The 2.25% credit spread for this loan is sufficient for the national bank to achieve a 15% return on equity (ROE), but with the sizable deposit accounts, the overall relationship ROE is just over 35%.

There are a few key elements for community bankers to consider from the graph above:
- The short end of the curve (out to two years) is higher than other points on the curve. This is not the optimal duration for borrowers – it is the most expensive portion of the curve.
- Long-term fixed-rate loans are more attractive to borrowers as longer-term commitments are up to 1.85% cheaper than floating rates.
- Banks that price loans as floaters or two or three-year fixed are at a disadvantage to those banks that can offer longer terms. Banks offering longer-term fixed loans can price more aggressively, widen their credit spreads, generate more fee income, or all of the above.
- Pricing borrowers on longer-term fixed rates immediately increase debt service coverage ratios – enhancing credit. Further, fixed rates also protect the bank if rates are higher and borrowers cannot cash flow. We cannot (and should not try to) predict future interest rates, but longer payment stability is better for credit quality.
- Differentiating your bank by offering longer-term fixed-rate loans can bring unique benefits in an inverted yield curve environment. Longer commitments enhance credit quality by eliminating repricing risk, lengthening and deepening relationships, differentiating from the competition, and increasing your borrower’s profitability by decreasing loan payments.
The national bank used its hedging program to offer this borrower the structures presented in the term sheet. We calculated that this national bank would also generate between $20k to $36k in fee income from this hedge (depending on the term the borrower chose) – further increasing the relationship ROE for the bank.
Conclusion
Banks, and the investing public, are hyper-focused on the fixed rate mix on banks’ balance sheets. Banks proactively managing their balance sheet have seen more floating rates added to their portfolio. Banks that are passive are finding that their fixed rate mix is increasing further, adding to their interest rate risk. The inverted yield curve makes adding interest rate risk easy.
The current inverted lending curve is a perfect opportunity for community bankers to utilize loan hedging tools to help borrowers lower their payments, help reduce interest rate risk, immediately improve credit risk, generate additional fee income, and, most importantly, retain valuable credit and deposit relationships. We offer a loan hedging program (ARC) built for community banks that avoids complex derivative accounting and arcane documentation. SouthState uses this same hedging program to help our borrowers lower their loan rates and decrease credit uncertainty – we also find that this program helps drive fee income and increases customer retention.

