Get Our Commercial Loan Pricing Grid

We are not big proponents of loan pricing grids. We find pricing grids to be rudimentary – lacking the myriad of inputs that distinguish risk-adjusted return on capital (RAROC), such as acquisition and maintenance costs, fees, interest rate, credit risk, and cross-sell opportunities (some of the most important drivers of banking profitability). We believe that every bank should use a RAROC model, and some of these models are offered free of charge (one example here). However, after numerous requests from clients, we will relent and provide a sample pricing grid for community bank commercial loans. We feel that a pricing grid is better than no benchmark pricing at all or chasing competition to the lowest priced offer. If nothing else, banks can compare their pricing grid to ours to see how close we are.
Our Loan Pricing Grid Methodology
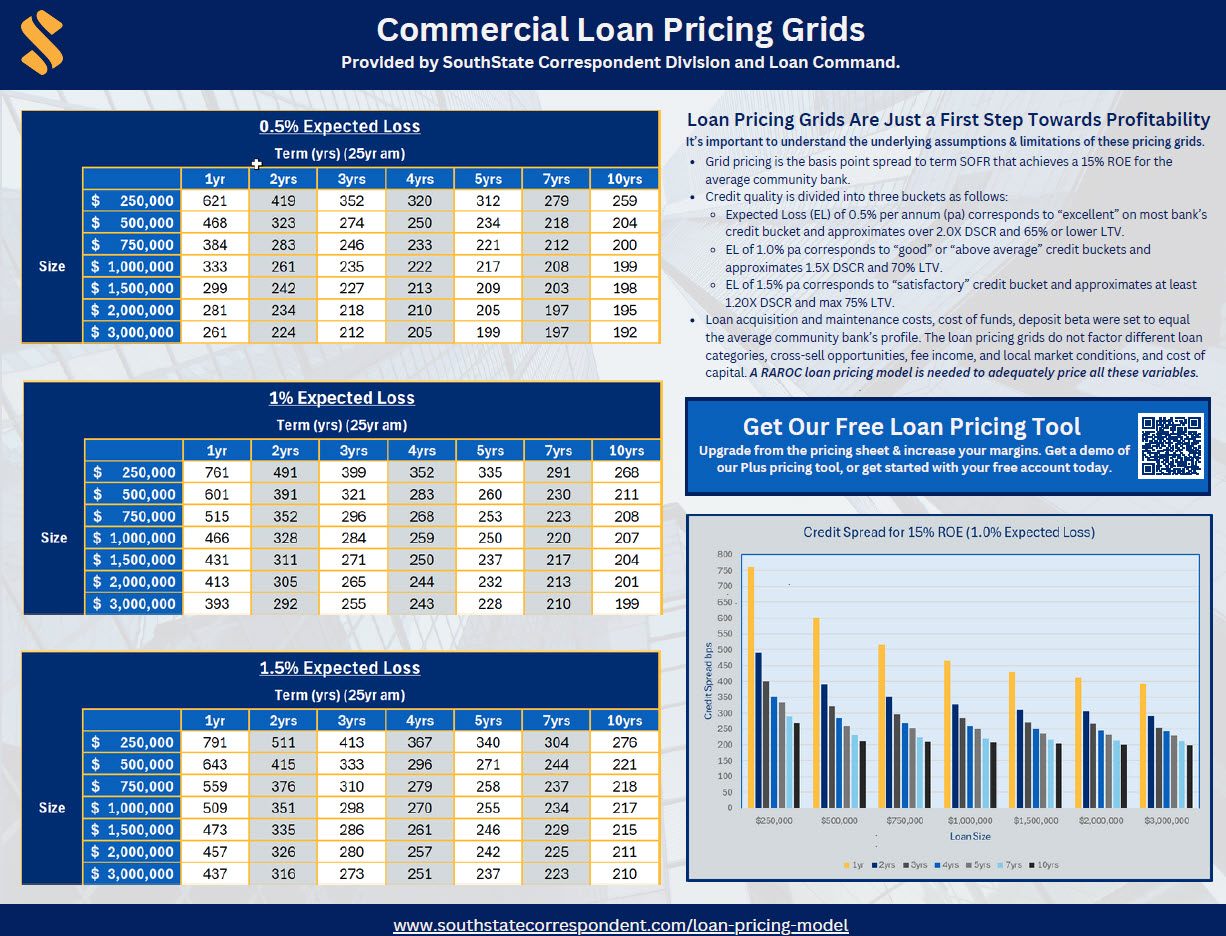
We ran hundreds of loan scenarios to solve for a credit spread to term SOFR that would achieve 15% ROE for the average community bank. Our loan acquisition costs, maintenance costs, cost of funding, deposit beta, and other general variables were set to equal the average community bank profile (although each bank will exhibit distinct characteristics). We varied credit quality between 0.5%, 1%, and 1.5% expected loss, loan sizes between $250k and $3mm, and terms between 1 to 10 years on 25-year amortization. We then solved the credit spread required to achieve 15% ROE.
We feel that a 15% ROE is a standard loan return target – although we have seen banks vary this target between 10% and 22%, depending on cost of capital, risk tolerance, business cycle, competitive pressures, product lines and future potential cross-sell opportunities.
We modeled an average bank and then used its maintenance cost, cost of capital, credit expense, expected cross-sell ratio and other assumptions to approximate the pricing needed for a 15% risk-adjusted return on equity, or roughly a 1% ROA. You should also consider bookmarking this page as we plan to update this grid as the environment changes and will be highlighting various sectors such as medical lending, office, retail, multifamily, and many others.
Our resulting pricing grids are available for readers to review HERE.
Key Takeaways
Credit quality, loan size, and term all influence ROE for lenders. Loans below $1mm in size disproportionately detract from ROE (and pricing these loans with additional credit spread generally becomes uncompetitive in the market). Terms below three years are also largely unprofitable. As a concept, you want the longest and most stable set of cash flows possible from a loan. On average, credit risk starts to rise in Year Two and peaks right after Year Five. The back-end cash flows of loans longer than seven years have very little incremental credit risk and provide banks with the greatest profit margin. Credit quality is a driver of ROE, and we ran our analysis on three credit quality buckets as follows:
- Pristine credit quality of 0.5% expected loss per annum. This corresponds to “excellent” on most bank’s credit buckets. This would be seen with over 2.0X DSCR and 65% or lower LTV.
- Good credit quality of 1% expected loss per annum or “good.” This is typically commercial loans at approximately 1.5X DSCR and 70% LTV.
- Acceptable credit quality of 1.5% expected loss per annum or “satisfactory.” These loans are at least 1.20X DSCR and 75% LTV.
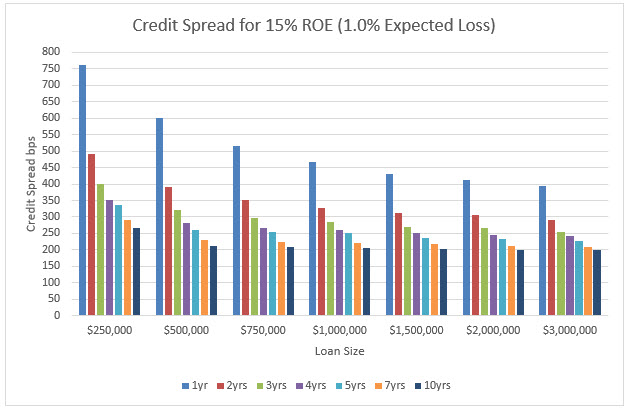
A graph detailing term, loan size, and appropriate credit spread for 1% expected loss is shown below. Our site also contains data for 0.5% and 1.5% expected loss credit spreads.
We envision that bankers wanting to use a loan pricing grid can make it available for lenders as a tool to establish pricing discussion with borrowers. The grids on our website is a starting point for community banks who can then add different loan categories, cross-sell opportunities, fee income, and adjust the credit spreads for their specific market, competitive pressures, and cost of capital. We are also willing to teach bankers how to create such pricing grids using our Loan Command model.
Putting The Loan Pricing Grid Into Practice
We feel that all community banks should allocate capital based on highest return and this philosophy applies to individual loans, clients, business lines, geographies and branches. To allocate capital appropriately, management first needs to understand the achievable RAROC from available various sources. For banks that are not currently using loan pricing models, or just dipping their toes to understand the methodology, loan pricing grids may be an easy way to start a RAROC discussion. Click below to see our loan pricing grids or to get started on creating your own grid specific to your bank, contact us.