Get This Fixed vs. Floating Loan Calculator to Help Borrowers

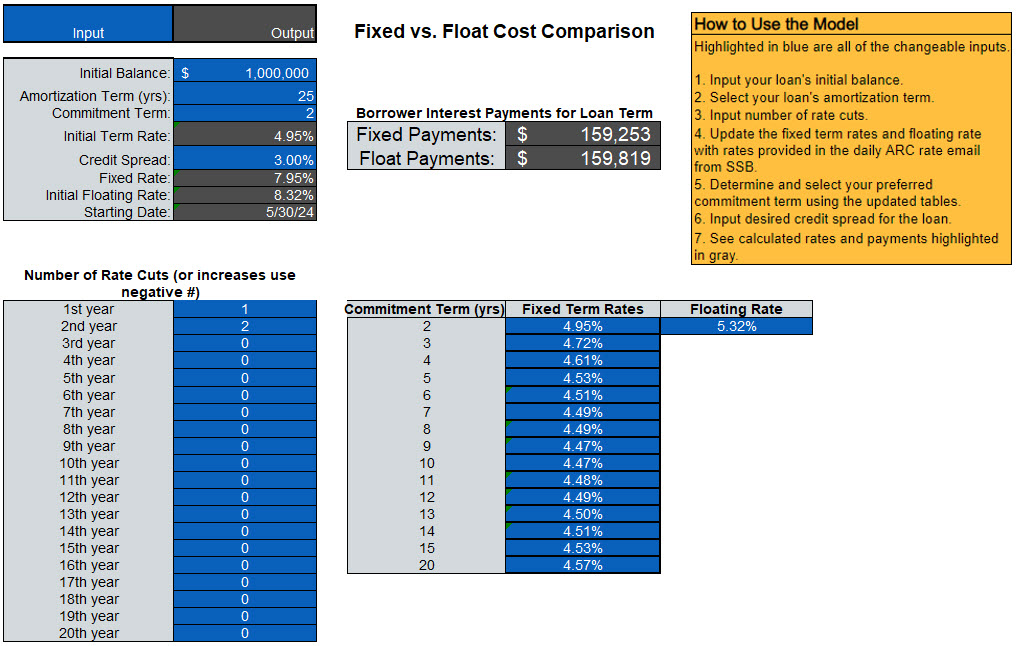
Most borrowers are implicitly expressing a view that interest rates will be lower in the future than the current market expectation. This view is reflected by a sharp decrease in the average contractual loan commitment term at community banks and an increase in floating vs. fixed rate structures. Borrowers are choosing short-term financing in anticipation of the Federal Reserve embarking on an interest rate-cutting cycle. However, few borrowers subject their hypothesis to any serious quantitative analysis – for example, how many rate cuts would be required to make the borrower indifferent between a floating-rate loan and a fixed-rate loan. We created a free model that allows bankers or borrowers to compare interest payments on various loan amounts, amortization periods, credit spreads, and commitment terms based on today’s yield curve. You may download the model Fixed vs Float Cost Comparison Calculator. However, community banks should carefully consider the prudence of a borrower’s decision based on the risks and rewards outlined below.
Fixed vs. Floating Analysis
We do not know where floating rates will be in the future—the market has a view, the Fed has a view, and borrowers may have another view. But no one can predict the future, and we are proponents of the simple tenet that long-term assets should be financed with long-term liabilities to stabilize the debt service coverage ratio (DSCR).
We highlight five assumptions that are implicit in every borrower’s financing decision based on predicting future rates:
- Changes in Market Expectations: Markets move rapidly, as witnessed by the Fed, stating that inflation was transitory, to hike Fed Funds rates by 5%, under a “higher for longer” mantra. No one can predict future economic realities.
- Credit Risk is one-sided: Many bankers understand that borrowers have a put option on their equity in a financing arrangement. Suppose an obligor cannot make payment on a credit facility. In that case, the obligor can turn over the project to the bank, but personal guarantees are difficult to enforce in systemic credit scenarios. Therefore, financing long-term assets with short-term liabilities adds credit risk that is disproportionately borne by the lender (25% equity vs. 75% debt). If rates are higher when a short-term loan matures, or cash flow is lower, the borrower’s debt service coverage ratio may not meet the bank’s underwriting criteria, or the ratio may be below 1.0X. Further, on most amortization schedules, the principal repayment in the first few years is exceedingly tiny, thus exposing the lender to more risk.
- Market Risk: The market is primarily wrong about the future of interest rates, but the market is abysmal at predicting extreme events. The Federal Reserve is waiting for the economy to slow before cutting interest rates; if the economy does slow, the extent of that deceleration is unknown. A recession may result in lower interest rates but also lower cash flow, wider credit spreads, lack of willingness by banks to lend, or additional asset classes being out of favor by banks.
- NOOCRE A Special Case: Borrowers with non-owner-occupied commercial real estate (NOOCRE) projects are especially precarious. NOOCRE financing is highly leveraged with minimal ability to lower operation costs or add different revenue streams. CRE loans are frequently highly leveraged: a loan underwritten to 1.20X DSCR, 76% loan-to-value (LTV), 9.2% debt yield, and CRE cap rate of 7.00% results in a loan leverage ratio of 10.83 (total debt divided by net operating income). To get the leverage ratio below 6X (a key underwriting criterion), a CRE loan would need to show 42% LTV and just over 2.0X DSCR.
- Sales Risk: Lenders are giving a free option to borrowers who finance with temporary credit facilities to anticipate savings in the future. Let us assume that a borrower financed long-term assets with a two-year floating rate, a recession did not occur, and market rates were lower as the forward curve predicted. The result is that the borrower paid higher interest rates during the short-term financing period and will obtain a lower rate (as predicted by the forward curve) on longer-term financing. The borrower’s blended rate is no better than had the borrower taken the longer-term facility at the initial entry point – this is the math of the forward curve and its current inversion. However, the bank will now need to compete for that borrower’s business again with possible irrationally priced competitors. Neither the borrower nor the lender achieved an optimal outcome.
Conclusion
Short-term financing may be the right choice for some borrowers, but financing long-term assets with shorter-term adjustable or fixed-rate facilities has several drawbacks. Our fixed vs. floating rate loan calculator creates a starting point for borrowers to perform what-if analysis and compare the cost of locking in a rate vs. the cost of floating a loan and being subject to short-term interest rate movements. As you run the calculator for your borrower, let us know if you want to see a formal PDF presentation showing the cost of a fixed vs. floating rate debt for your specific borrower.