Managing Loan to Value with Rising Rates
If your bank is like most of its peers, your credit policy permits loan to value (LTV) ratios somewhere between 65% and 85% depending on the category, business cycle, and other forms of support. In today’s competitive lending market, many banks are pushing boundaries, and loan to values are creeping higher. We argue that banks should be especially vigilant in managing real estate (RE) leverage, and we see some top-performing banks chasing sub-60% LTV deals at extremely tight spreads. We believe that the tradeoff between lower RE leverage and tighter spreads is now especially prudent.
Background on Loan to Value
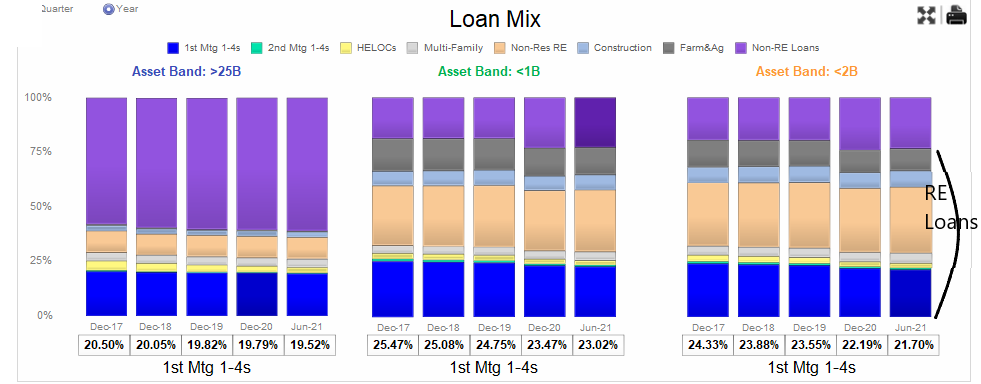
First, community banks’ business model is highly real estate-focused. The graph below demonstrates the loan mix of banks by various asset sizes. Banks under $2B in assets have 80% of their loans secured by real estate, and the value of that real estate is significant for those institutions.

Second, real estate values typically decline when interest rates rise. However, very few bankers working today have firsthand knowledge of this phenomenon. Some bankers working today experienced the US real estate market in the 1990s when values were depressed because of significant overbuilding and a weak economy. However, interest rates were mostly declining during that period.
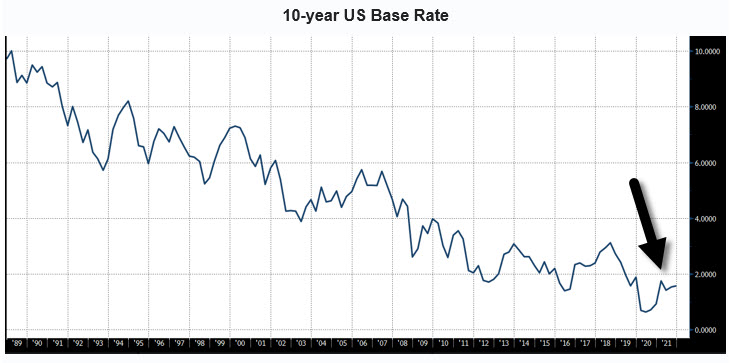
More bankers working today were around in 2007 when real estate values fell and collapsed in 2008 and 2009. The collapse at that time was caused by the financial and liquidity crisis and not because of overbuilding or excess supply. But again, interest rates were declining significantly during that period. Real estate enjoyed a 10-year run from 2010 to 2019, during which property prices moved higher until the Covid-19 pandemic led to another real estate value decline. However, the credit impact of that decline was offset mainly with monetary (again, lower interest rates) and fiscal (large government payout) policies. The graph below shows the 10-year base rate from 1987 to the present – through every real estate recession (and the last 34 years), interest rates have been mostly declining.

Third, the value of real estate is determined by discounting the income that the property produces by a discount rate. The most simple form of this calculation is the direct capitalization method. The value of the real estate using the direct capitalization formula is as follows:
Value = Net operating income (NOI)/Cap rate
The Cap rate is based on future NOI growth, risk of that NOI, and the risk-free rate. Very simply, the formula for the Cap Rate is as follows:
Cap rate = Discount rate – Growth rate of NOI.
The Discount rate is the risk-free rate (the 10-year Base Rate is a good proxy) plus the risk premium for NOI volatility. If interest rates go up, the discount rate goes up proportionately, and the Cap rate rises. The mechanism is straightforward – higher rates lead to lower real estate prices unless or until the property NOI can be increased proportionately with escalation clauses or re-leasing.
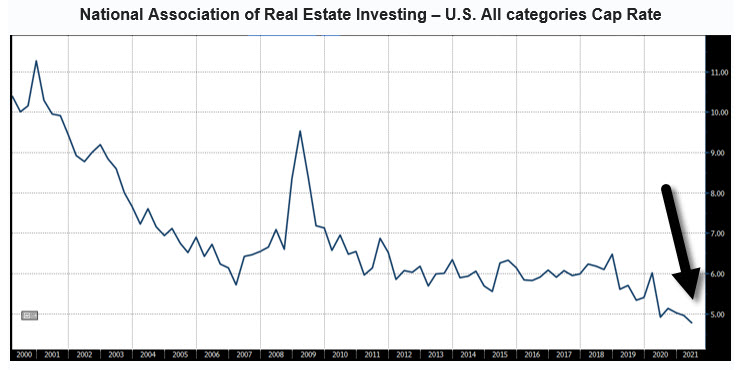
Fourth, current Cap rates for all US properties are at an all-time low. The graph below shows U.S. cap rates on all RE categories currently at 4.77%. Cap rates could go lower, but if interest rates rise, that becomes extremely unlikely.
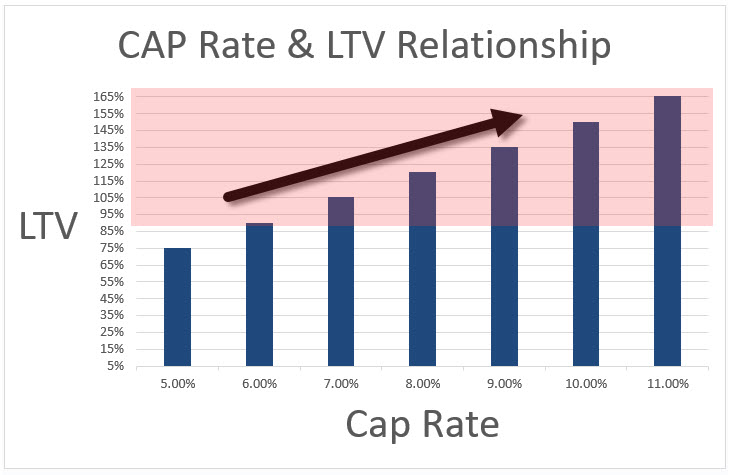
Fifth, what would happen to cap rates if interest rates rise without any changes to expected NOI or volatility around that NOI (the risk premium for holding real estate)? That relationship can be quantified and is demonstrated in the graph below. For loans starting at a 75% loan to value and 5% cap rate, every 1% increase in the cap rate increases the loan to value by 15%. If nothing else changes in the real estate market other than an increase in the base rate, banks relying on real estate value for collateral will experience a very rapid erosion of that coverage.
The same decline occurs at a different starting cap rate – the decline in real estate value from rising rates is rapid if not offset by increased NOI. However, the decline in value is less extreme at a lower starting LTV, and there is more room for erosion because of the lower starting leverage. For example, at a 50% loan-to-value, every 1% increase in the cap rate increases the LTV by 10% (instead of 15%). Another way to look at this is that if you are starting at an 80% loan-to-value or above, your loan will quickly move into the “red zone” with higher rates. The red zone is where a will not only take a loss if there is a default but will take a loss in excess of their reserves. In other words, every loan in this red zone is a direct hit on capital should there be a payment default without a cure.

Loan to Value in Conclusion
Every real estate cycle in the last 35 years has been accompanied by decreasing interest rates. There is a strong possibility that rising rates may lead to real estate value erosion for senior secured lenders even if we do not have a recession or a typical real estate cyclical downturn. Now would be an opportune time for lenders to quantify the tradeoff between debt leverage and loan margins because interest rates are likely to increase, and it is reasonable to suspect that cap rates will follow.


