More Data Around Changing Branch Strategy

Last April, we published a piece (HERE) about how the pandemic has shifted traffic patterns to permanently impact branch strategy. We discussed how a combination of a faster shift to mobile banking during the pandemic and fewer trips to work, school, transportation hubs, and retail outlets had changed branch placement. Traffic to urban core branches, for example, is down considerably compared to suburban and rural branches. In this article, we dive a little deeper into the data and compare traffic patterns from the 1Q pre-pandemic period to June 3rd.
General Traffic Patterns
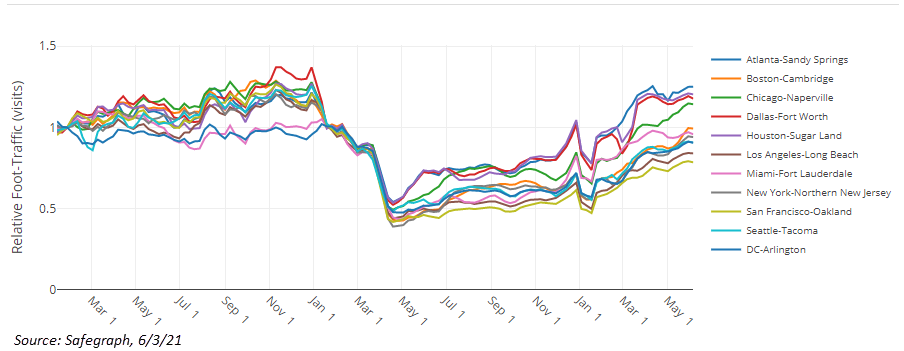
For the most part, bank customers are moving around in public spaces to near-2019 levels. Foot traffic is up 26% compared to the pre-pandemic baseline in early March of 2020. This is consistent through most of the U.S. (below), except for Vermont and the West Coast.
Delving further into the data, we can look at major metro areas and see that foot traffic is still down, particularly in places like San Francisco (79% of normal), Los Angeles (84%), D.C. (91%), Seattle (91%), and NY (94%). Offsetting these areas, places like Atlanta, Dallas, and Houston are up 20% or more.
Traffic by Industry
As we break the data down to specific industries, we can now see our first level of actionable data regarding branch placement. Below you can see that certain traffic centers such as movie theaters and airports are down 70% and 35%, respectively. While these industries will continue to come back, they may not return 100% over the next several years. Even a slight change in traffic to a retail center or airport where you might have a branch or ATM can impact profitability. Conversely, branches near medical centers are likely to experience an increase in traffic both in the short-term and long-term as traffic to these locations is likely to remain elevated.
The Rise of Cell Phone Data in Branch Modeling
As we previously highlighted, banks can now use historical and real-time data from cell phone signals to inform their branch model and placement. We can look at any given area and see the shift. Below, using Google’s Mobility Reports, we can see the shift of cell phone traffic from workplaces to work-from-home.
For banks with branches in Atlanta, commute traffic to and from work is down a significant 47%, while traffic around the residence is up 11% (below). This is typical of a metro market. Note the implications of this. People are leaving their houses these days even more than before the pandemic there are just not going to work. Their traffic patterns have shifted.
Secondary Markets
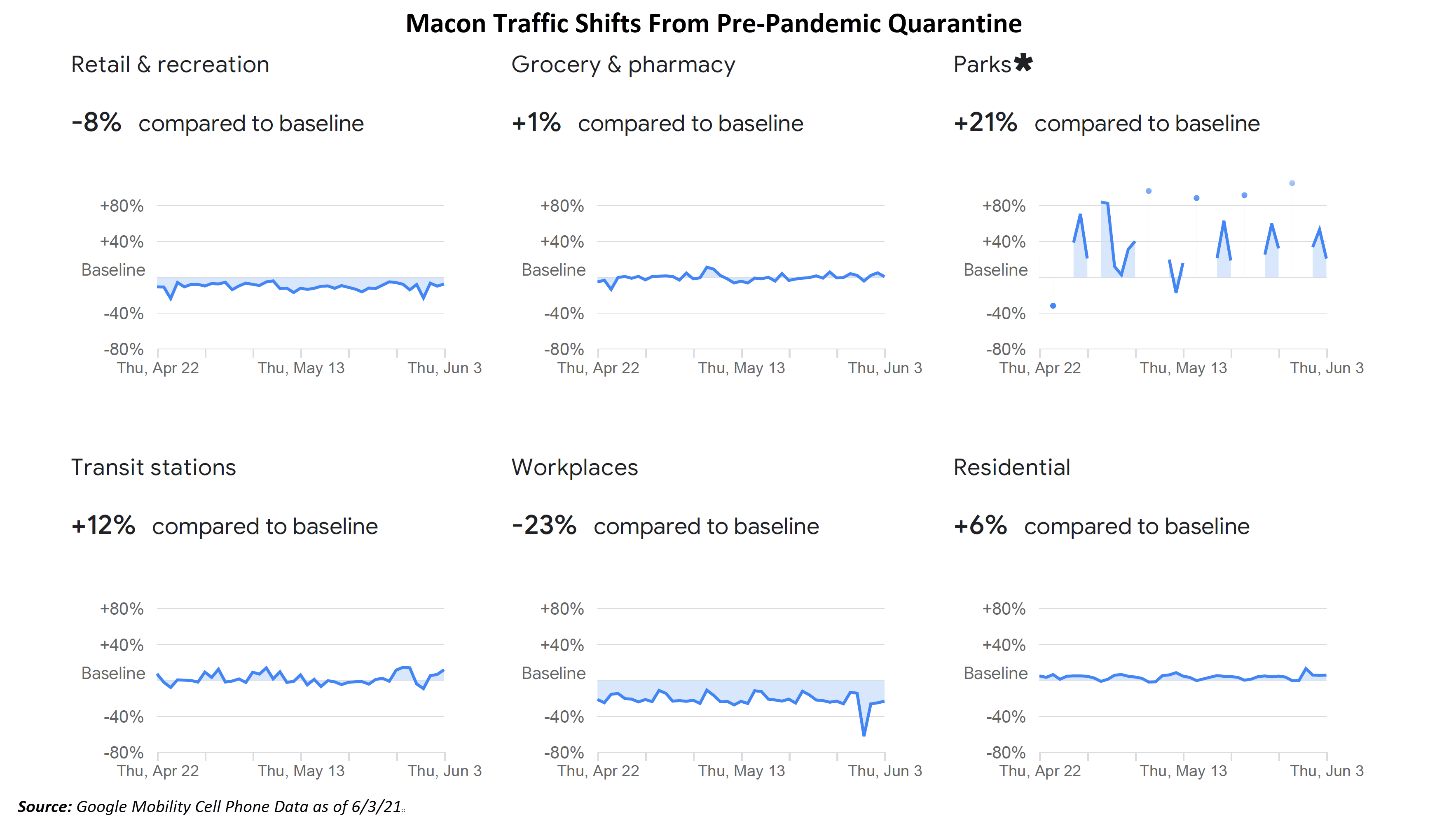
While the above is typical of major metro markets, most of the country’s secondary metro markets look like the below. This data happens to be from Macon, GA, and is representative of most typical secondary or tertiary markets. Here, you can see a similar but more muted response. Banks in these markets have less of a need to shift their branches or branch marketing. That said, a 23% drop in downtown traffic is still material and could have some banks rethinking branch capital allocation.
Rural Markets
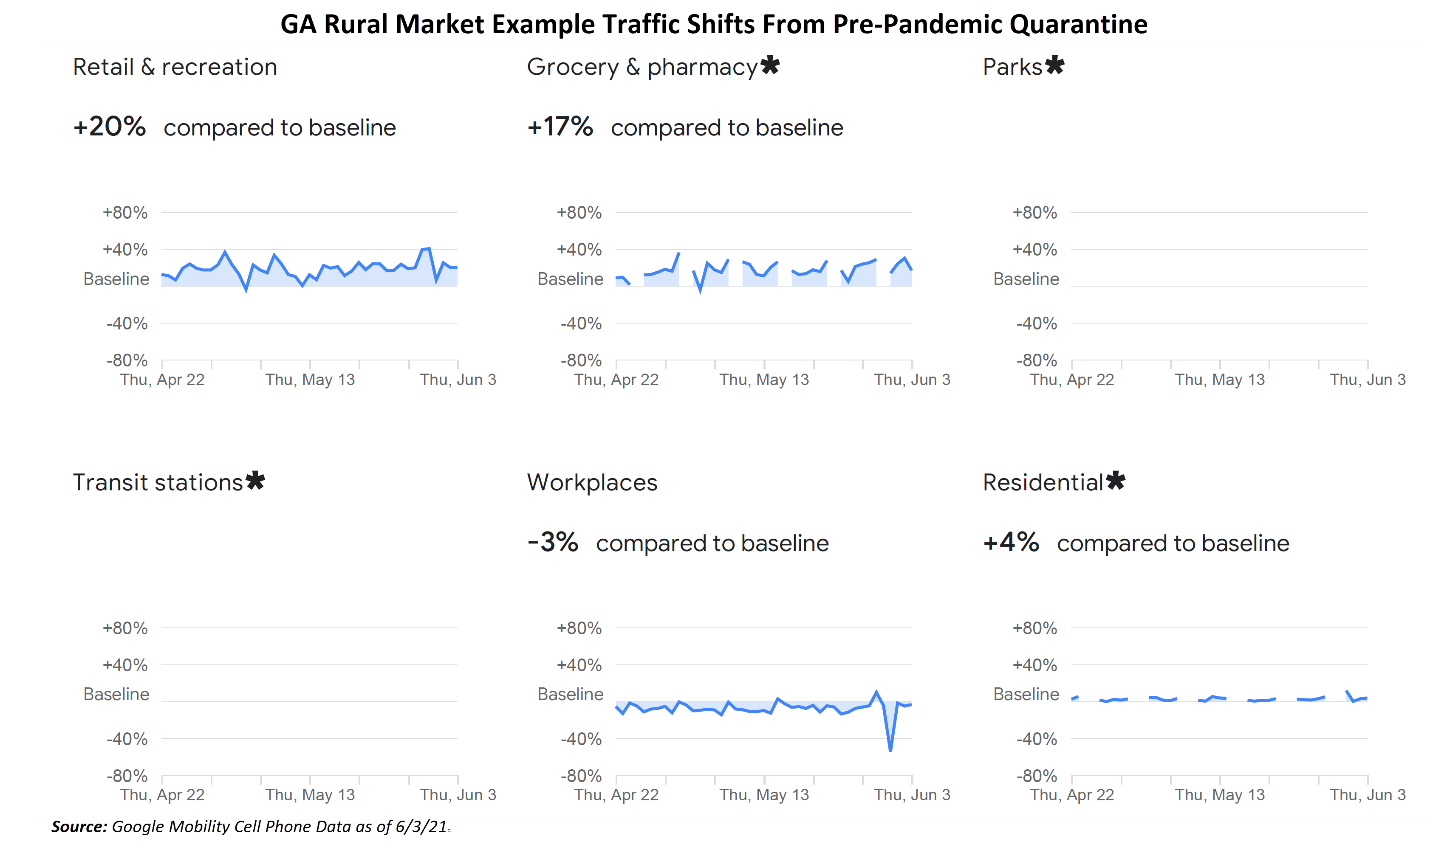
Finally, we can investigate rural markets, where you see a much more muted response. Here, you can still see workplace traffic down and residential time up, but only on the order of three or four percentage points. This is not likely to make a difference in rural branch traffic or profitability.
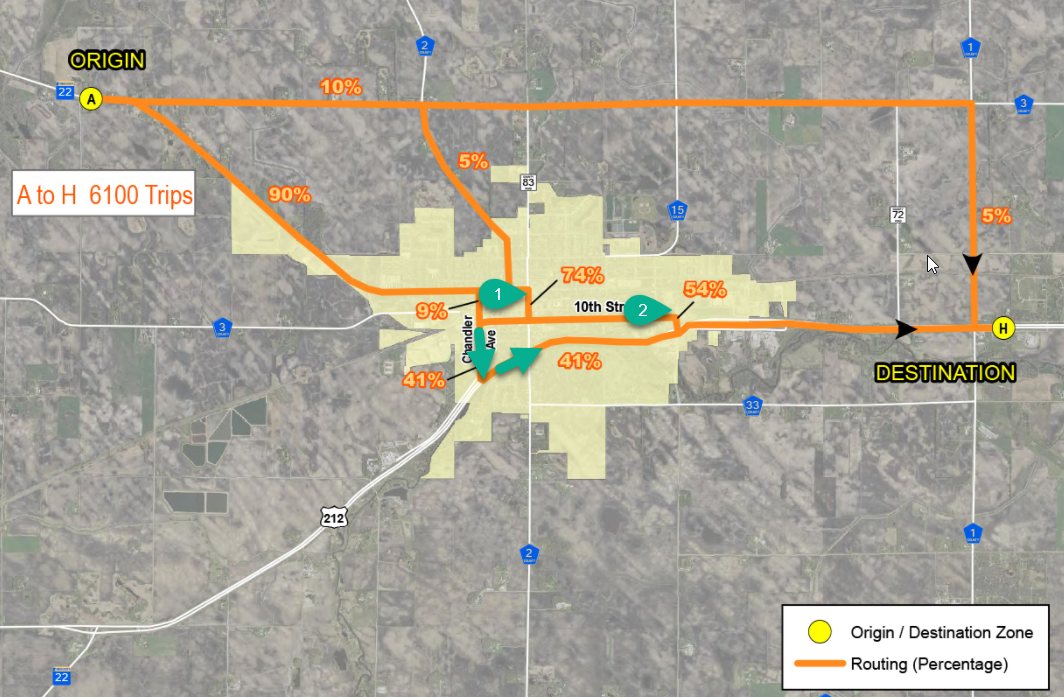
For the next level down in branch modeling, we can utilize an “O.D.” or “origin-destination” study. Here, banks can pull cell phone data and look at where people start and stop their journeys. As can be seen below, not only is traffic down in this tertiary town core, but traffic patterns have shifted. Now, 59% of the town’s traffic is en route to another destination and is only passing through the city. This places Branch #2, in green below, at greater risk of having lower foot traffic.
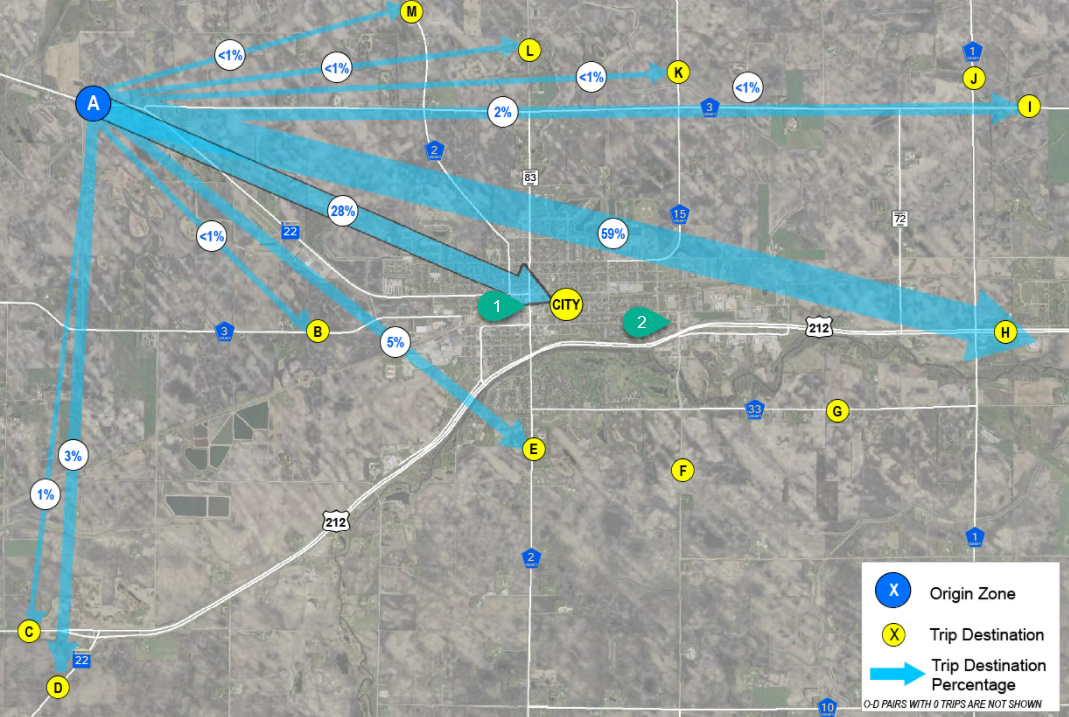
In looking at this data, it can be seen that not only is traffic lower for Branch #2, but more travelers are using the “Western Bypass” highlighted in the green arrows as they go further south to get on the 212 freeway. This raises the question is, does the bank wants to keep this second branch in this city, and if they do, how can they increase traffic?
The answer lies in the knowledge that the average customer in Branch #2 is very different than Branch #1. While the Branch #1 customer likely lives in town and commutes to the town center for work, the Branch #2 customer is likely from parts further to the west and is passing through to the major metro area to the East. This means that the marketing of a service area for Branch #2 is both different and larger than Branch #1. The message is also different as the bank must convince travelers that parking and access are easy on the daily commute, plus there is a reason to interrupt the commute going to and from the office.
Geolocated Marketing to Increase Profitability
If we want to drill one more layer down in the data, we can derive the times that these commuters leave and return to and from both the origin and destination. By knowing the times and the location, banks can now serve digital ads during critical times, such as at breakfast when people check their phones to catch up on the news. This tactic is fantastic at targeting small and mid-sized business owners to let them know of Branch #2’s business and merchant capabilities. By hyper-targeting marketing resources, banks can alter the product mix of the branch, thereby making the branch more profitable.
Putting This into Action
More remote work, greater penetration of online banking, and changing commute patterns combined with better data have altered every bank’s branch model. While it is too soon to tell where commute traffic will settle out, we now have enough data to reliably model and predict these changes over time.
Community banks have a huge advantage over larger banks as they can more quickly focus on these changing patterns and be agile as they consider relocating some branches in downtown areas, reducing branches, or introducing new marketing programs to take advantage of remote work or changing commute patterns. Many of these smaller markets will be overlooked for years by national banks allowing the agility of community banks to gain market share.