Optimizing Loan Duration
Customers and competitors are challenging community banks to extend loan duration – borrowers are eager to lock fixed rates before they rise further, and many competitors are happy to oblige. But what are the optimal fixed terms for community banks given today’s interest rate, credit, and liquidity environment? While every bank’s mix of deposits and loans is different, community bankers should consider some common themes in the market when optimizing their balance sheet loan portfolio.
Optimizing Loan Duration – Industry Comparison
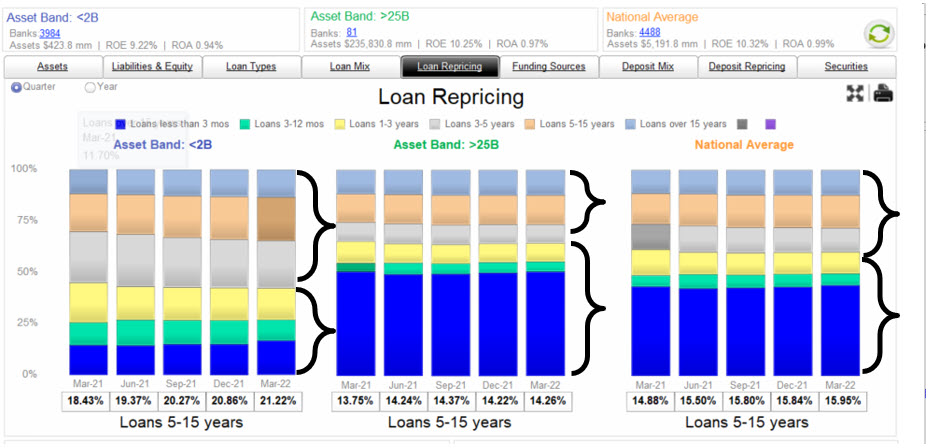
The graph below compares the loan repricing mix for banks under $2B in assets, over $25B in assets, and the national average over the last year. While call report data is not ideal for this, it is directionally correct. The top three bands (grouped by the gullwings) are fixed-rate loans, and the bottom three bands (also grouped by the gullwings) are floating and adjustable loans. Community banks originate more fixed-rate loans and have increased fixed-rate loan originations over the last year. In contrast, larger banks have maintained the same (and larger) mix of floating-rate loans over that period.
We believe that the main explanation for this different loan repricing in the industry is that larger banks originate a greater portion of their loan portfolio as fixed-rate to borrowers but are doing so through hedging programs where the borrower pays fixed, and the bank earns a floating rate.
The Optimal Fixed-Rate Term
Whether your bank has a hedging program, what is the optimal fixed-rate loan portfolio in today’s competitive environment? We need to analyze the current lending environment and the market’s future expectations to answer that question.
The Lending Curve
The other piece to the puzzle when it comes to optimizing loan duration is making sure the borrower has the structure and the rate they need. A yield curve shows interest rates associated with different contract lengths for a particular interest rate instrument. A lending curve shows borrowers’ loan coupons for different terms. The lending curve is currently strongly determining borrowers’ demand for loan structures.
The graph below shows the lending curve from one month out to 20 years. This lending curve is determined by commercial loans that are priced on uniform credit quality, loan size, cross-sell opportunity, and overall relationship. The lending curve below assumes a $1mm, bankable credit, with a risk-adjusted return on capital (RAROC) of 15%. This currently translates to 2.25% credit spread over the risk-free rate.
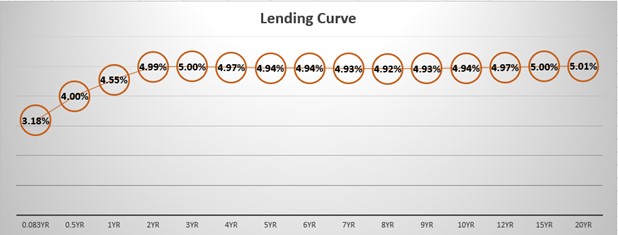
The only part of the curve with any steepness is one month to two years, with a carry of 1.01%. Banks can gain about a one-point higher rate for a 2-year fixed-rate loan than a monthly floater. Anything beyond two years gains virtually no carry trade for the bank. Note that the five-year portion of the curve is lower than the two-year. The lending curve is a market-driven and equivalent ROE – meaning that some banks may be able to negotiate higher (or lower) coupons with their borrowers across this lending curve, but the lending curve is an efficient market-driven equivalency for pricing loans given interest rate, liquidity and credit risk. Because the market is not compensating lenders beyond two years, it makes little sense for banks to take interest rate risk beyond two years, without mitigating that risk.
Market Expectation
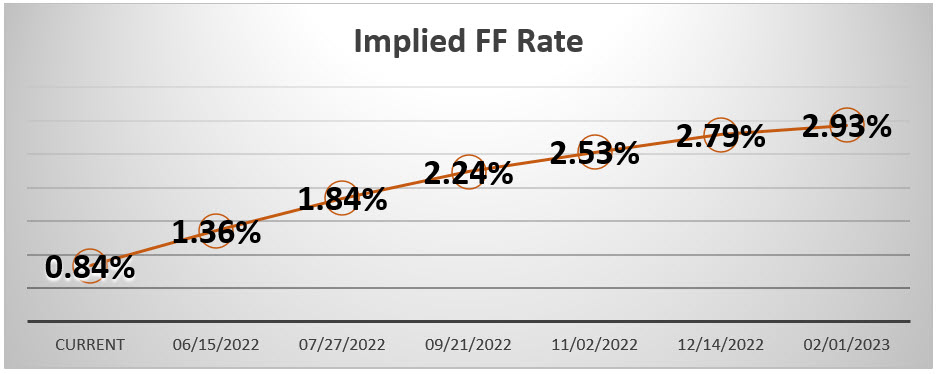
When optimizing loan duration, one piece of the puzzle is the market’s expectation for rates. Historically, the carry trade for banks yielded 1.50% to 2.00% in extra yield – banks borrow with lower-rate, short-term deposits and lend on the longer end of the curve (typically five years). However, the carry trade today is only about 1.00%. What makes the carry trade especially unappealing for banks is that short-term rates are expected to rise more than 1.00% in the next six months.
The graph below shows that Fed Funds are expected to increase to 2.79% by year-end, or 1.95% from their current level. This expected increase will eliminate more than the entire carry trade in the lending curve. While many banks’ cost of funds (COF) will lag the market and deposit betas will be less than 1.0, with quantitative tightening and an increase in short-term rates, banks have little room for a profitable carry trade with rising industry COF.
Credit Spreads
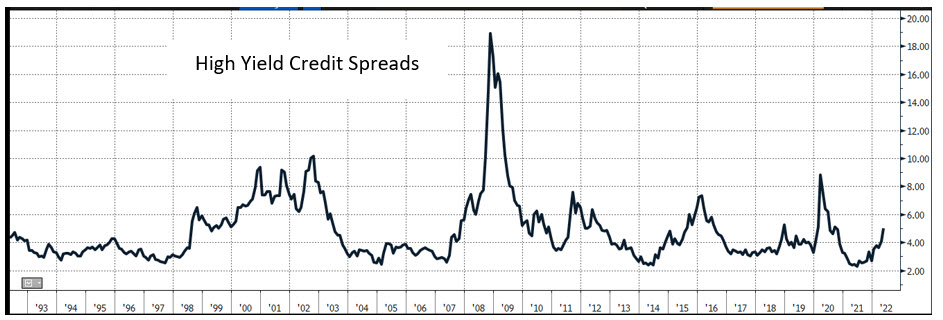
The lending curve is the sum of the risk-free rate and the credit spread. The risk-free rates are low by historical standards, but so are credit spreads on bank loans. While, capital market credit spreads are widening, as shown by the graph below (high yield credit spreads have ballooned by 2.74% since the Fed turned hawkish). As an aside, for banks that want to track credit spreads on their own and make their loan pricing more responsive to the capital markets a good source of market information can be found HERE.
Loan credit spreads at most banks have not moved, as shown in the graph below. This is a common development in a rising interest rate environment – lending spreads lag capital market spreads. We see current commercial loan spreads under continued pressure, and the market does not expect that to reverse until we enter a recession or when liquidity is drained from the banking system.
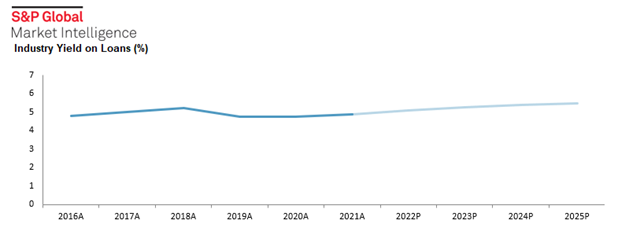
Banks that book long-term fixed-rate loans may not only see their net interest margin (NIM) contract with rising rates, but those banks are also booking loans when credit spreads are near historic lows. Those banks that are adding loan duration to protect the bank from a future decreasing interest rate environment are booking both a low risk-free rate and a low credit spread. A better strategy is to add duration in a declining economic environment (with sound credit quality) when credit spreads are expanding.
Optimizing Loan Duration Conclusion
When it comes to optimizing loan duration in this environment, banks can start with the framework above. In the last 40 years, community banks kept fixed-rate loan maturities to five or seven years and were able to earn an outsized profit with a carry trade as interest rates declined. However, that strategy is ineffective if interest rates continue to climb from a historically low level (See our three-part series HERE). While every bank’s balance sheet composition is different, the market and near-term projections create a poor environment for adding fixed-rate loan duration.

