
4Q 2026 Commercial Loan Pricing Trends and Projections

A couple of weeks ago we did a deep dive on the state of community bank forward looking credit (HERE). Today, we build on top of that by discussing historical loan pricing to help in bank benchmarking plus provide insight into what is ahead for loan pricing given potential interest rate movement and credit. We will cover non-real estate commercial and industrial (C&I) lending and commercial real estate (CRE) lending.
General Commercial Loan Pricing Trends
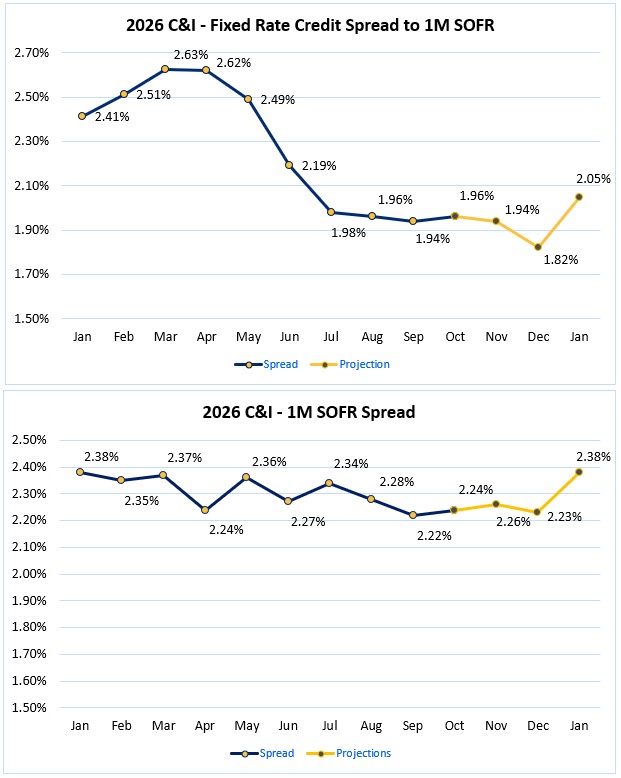
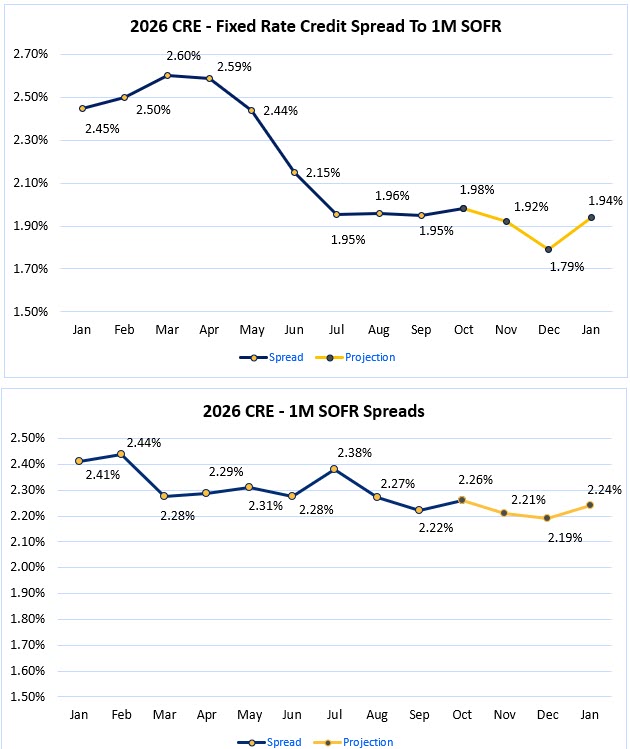
As discussed back in both 1Q and 2Q, loan pricing moved wider due to political and market volatility combined with rising intermediate term rates. Banks placed fixed rates on their books and as rates fell, banks enjoyed wider spreads. That is, until March, when the trend started to reverse and rates rose. At that time, rising fixed rates serve to compress spreads at banks until the banks became more cognizant of rising rates.
We highlight this as the same thing is about to happen with the potential of either a 25 bps or 50 bps rate hike in December. This volatility will catch many banks putting both fixed rate loans on their books in the face of rising rates and holding a fixed rate constant for the customer during the month of December in essence giving the customer a free rate option.
Separate from the interest rate risk, banks are still eager to build loan balances which will increase the supply of credit and further tighten pricing. By January, this trend will reverse and banks that were caught in the rate hike by the Federal Reserve and year-end closing, will take a pause in January thereby widening spreads.
As can be seen in the charts below, pricing or hedging off 1-month SOFR has resulted in more consistent margins in addition to reducing interest rate risk.
Additionally, C&I remains in demand compared to commercial real estate, explaining the tighter spreads.
Pricing by Credit, Loan Type and Loan Size
For banks that utilize our Loan Command profitability management tool, all this data, including forward looking probabilities of default and loss given default are resident. Being able to take into account a basic funds transfer pricing model, product profitability, the forward curves, and credit updates gives your bank a steering wheel to drive profitability. We have a free version of the model so there is little excuse for a bank to price blind.
If you have another model or don’t believe in steering wheels, then at least use our updated matrix below to help benchmark your pricing to the market. Below, we break down commercial loan pricing by credit rating, loan type, and loan size.
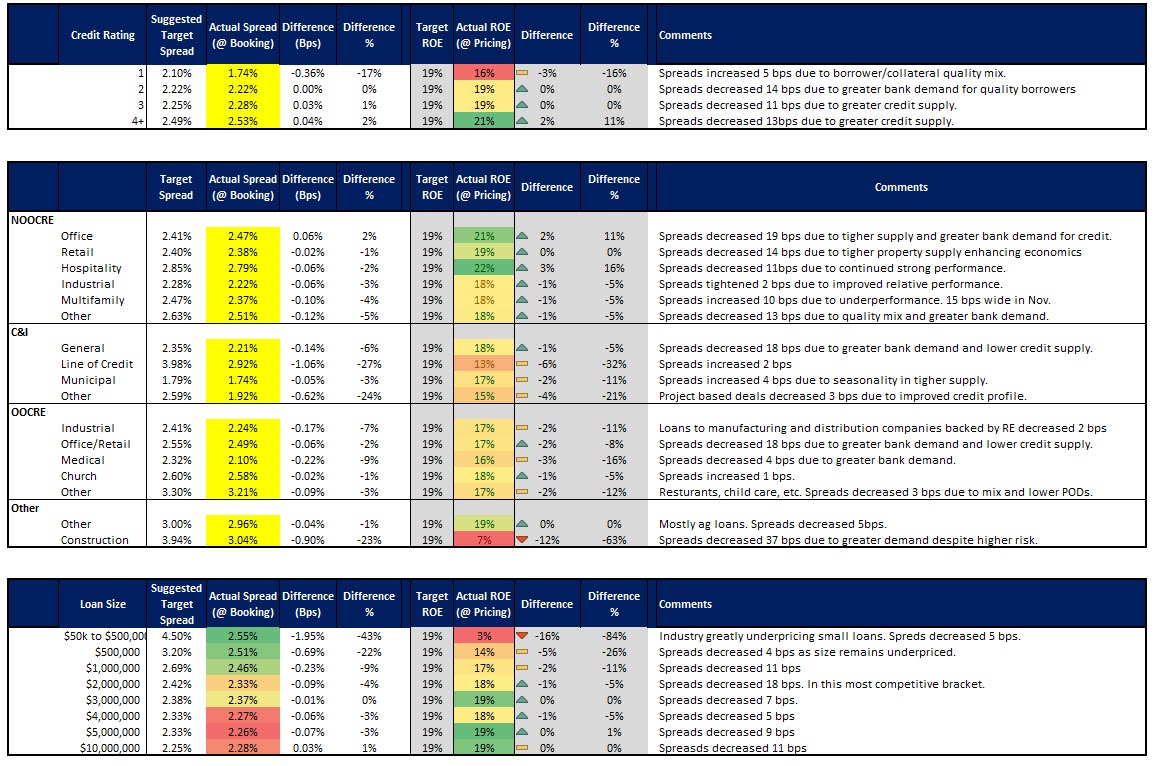
Here are several insights that jump out:
Risk-adjusted Return on Capital (RAROC): Due to higher net interest margins, target ROE increased from 18% to 19% in the fourth quarter. Improving probability of defaults offset higher loss given defaults and greater credit utilization (now at almost 46% on lines of credit). Further, tighter credit spreads was more than offset by wider interest margins.
Investor CRE: Investor, or non-owner occupied continues to do well largely returning a 21% RAROC into November. Hospitality, office, and retail produced outsized returns. Multifamily loan pricing increased an average of 10 bps given an increase in credit risk.
Underpriced Areas: Small loans and construction continue to be underpriced.
Putting This Into Action
Higher credit and interest rate volatility demands a RAROC pricing model and for bank management to monitor competing loan pricing. In this market, banks need to have a clear view of the risk they are taking on and price accordingly.