Overcoming Interest Rate Challenges in Banking

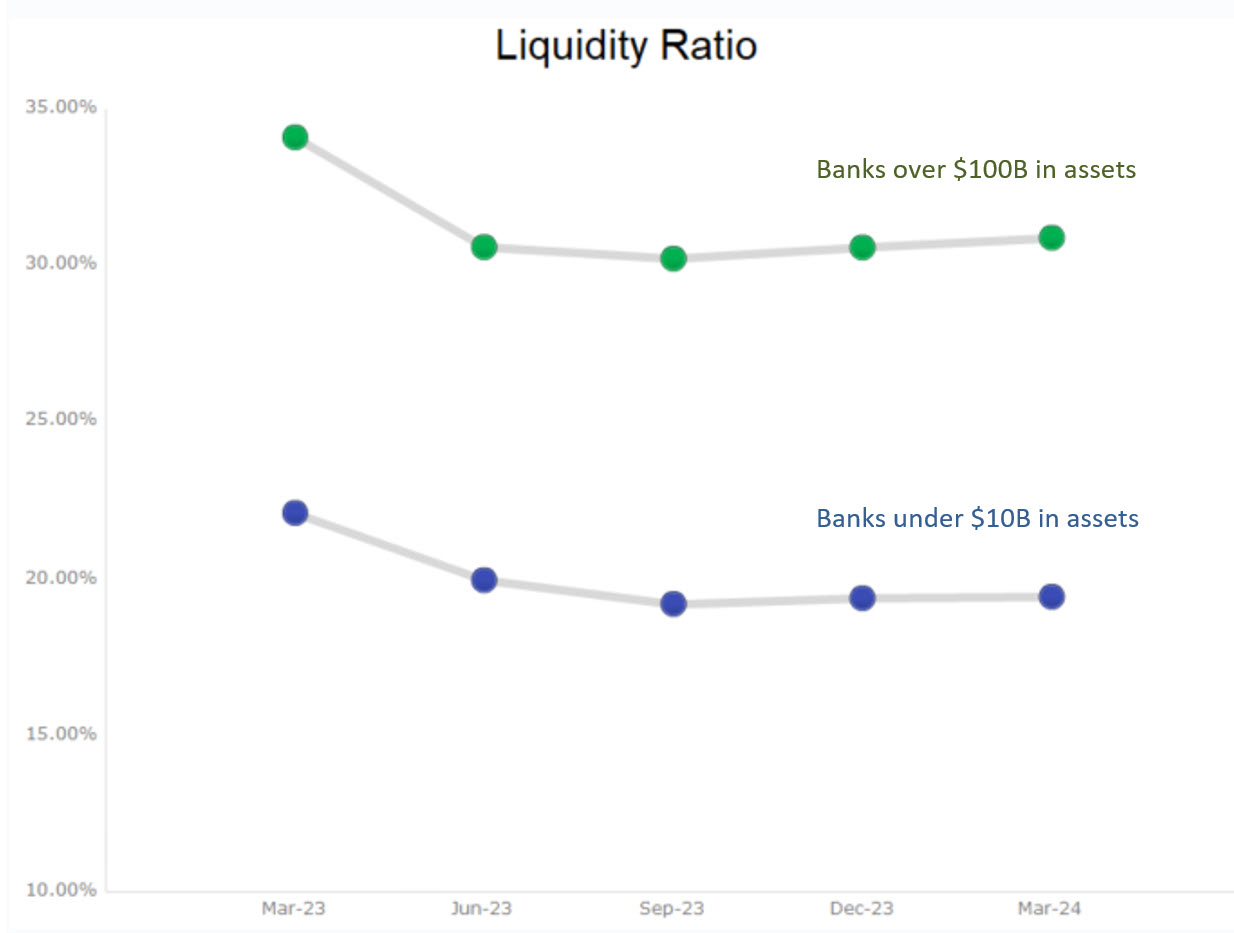
Deposit costs and liquidity remain a challenge for some community banks as competition for core funding remains intense. The graph below compares the liquidity ratio for community banks (under $10B in assets) and banks over $100B in assets. The average difference in liquidity is stark, but for many community banks the issue is translating to higher rates on deposits, margin squeeze, and lower profitability. At the same time, some community banks had longer duration assets that did not reprice during the last rate hiking cycle, thereby hurting net interest margin (NIM) and profitability. This article discusses how community banks got to the current state of interest rate risk challenges, what community banks can do about this funding and asset issue now, and how to model interest rate risk to avoid negative outcomes in the future.
How Interest Rate Risk Challenges Increased
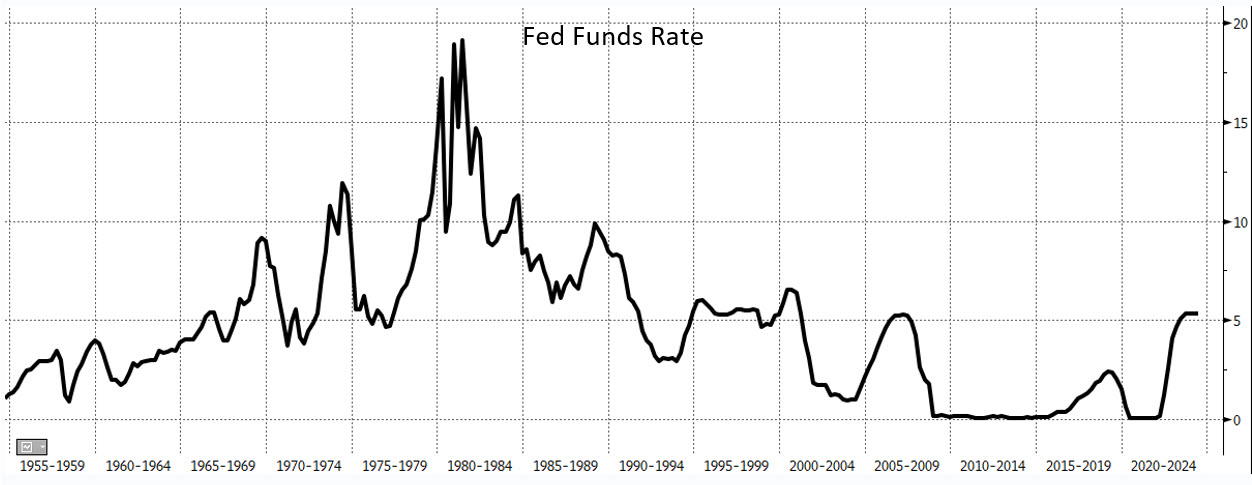
Interest rate risk challenges came to the forfron when the Federal Reserve embarked on an interest rate hiking cycle, taking the fed funds rate from just under 10 bps in March of 2022 to 5.33% in July of 2023. The rise in rates was rapid, but the ultimate level of interest rates is well within the average of recent history (see graph below).
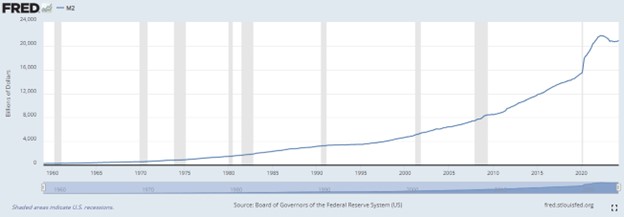
What is more surprising than the current nominal level of interest rates is that during the same period of the rate hiking cycle, we saw a 5% decline in money supply (as measured by M2) as shown in the graph below. This is the first time in modern history where US money declined, and this was just a partial reversal of the enormous M2 increase (16%) during the pandemic.
Many banks that believed they had a conservative and properly matched mix of funding and assets in 2020 and 2021, were negatively surprised in 2023 and 2024 when deposits migrated from demand deposit accounts to interest-bearing accounts, placing pressure on cost of funding and NIM. On loan repricing, during the interest rate hiking cycle, community banks had an average fixed-to-floating loan mix of 51%:49%, while banks over $100B in assets had an average fixed-to-floating loan mix of 32%:68%. This deposit and loan repricing mismatch caused NIM pressure at community banks. The graph below compares NIM for community banks and banks over $100B in assets – the average community bank’s NIM decreased by 11bps during the last three years, while the average bank over $100B in assets saw NIM expand by 69bps during that period.
What Can Be Done
Some community banks are still feeling pressure on cost of funds (COF) because of product mix shifts (from DDA to savings and CDs). This is especially true for community banks that compete for retail deposits. Modest decreases in interest rates (25 to 75bps) will probably not fix this funding issue. Community banks do have a few strategies for mitigating COF pressures.
First, a focus on primary commercial relationships can attract non-interest bearing (NIB) operational accounts. DDA betas (when factoring earnings credits) are under 0.10 and represent a terrific opportunity for community banks in the business banking and government segments. However, community banks need to price these relationships accordingly, provide meaningful and differentiated products, and hire staff competent to sell treasury management services. Second, community banks should spend more on retail deposit marketing and staffing. Until 2023, deposits would simply flow to community banks. This is no longer the case and banks must focus on more profitable deposit segments versus mass marketing or branch building. The average community bank spends just a few basis points of total deposit costs on a marketing budget. Increasing marketing and personnel budgets, especially geared at checking and savings accounts can decrease overall COF by dozens of basis points in today’s environment. Third, especially in an inverted yield curve environment, community banks must shift their loan mix to shorter repricing buckets. In this rate environment, every community bank should consider a loan hedging program for its commercial loan customers.
Interest Rate Risk Modeling for Community Banks
As interest rates rose from record lows, larger banks (on average) have profited, but some community banks exhibited lower NIM and lower return on assets (ROA). Almost all community banks were hurt by competition from direct banks, fintechs, and national banks. The question for many community bank risk managers is how can their bank do better in the next three to five years with the potential for other macroeconomic surprises?
The issue is that larger bank risk modeling does not always translate well for community banks. There are, however, four key elements that most community banks can use to improve interest rate risk modeling and planning.
First, avoid static modeling, pricing, and risk management decisions. Some bank models build various interest rate scenarios keeping the balance sheet, pricing, and prepayment speeds static. This hardly makes sense. Most risk managers intuitively understand that in a changing interest rate environment, behaviors, pricing, lifetime value, and prepayments all change. Therefore, any modeling, pricing and management decisioning must reflect these changes.
Second, avoid modeling only likely future outcomes. For example, we hear banks planning and managing for future interest rate cuts of 75 bps over the next 12 months. However, managers must consider all aspects of rate risk, using probability of any outcome. The model assigns some probability of decrease in short-term rates over the next 12 months in 25 basis points increments and some probability to interest rate increases in similar increments so that any possible outcome from zero rates up to 10% fed funds has a possible (however unlikely) outcome.
Third, build out cascade events. Scenario-based models must be able to account for how one variable feeds into another variable, and a third variable. How will interest rate movement change customer prepayment behavior, and how will that behavior change customer segments at the bank? Banks that did not attribute interest rate movements to deposit decays were caught off guard on deposit costs.
Fourth, community banks did not need hedging products in an era of low and steady interest rates; however, that is not the case today. In a more volatile rate environment, community banks should embrace simple hedging strategies that allow them to manage interest rate risk, mitigate credit risk, and dictate customer behavior (in the form of prepayment speeds and cross-sell opportunities).
Action Items
Community bankers who want to improve their banks ROA/ROE must understand the macroeconomic picture that has shaped their bank performance, how to solve current profitability hurdles, and understand how to properly model their bank for future unknown developments. While national banks have more sophisticated tools and larger talent pools, almost any community bank in the country can avail itself of a simple and inexpensive risk-adjusted return on asset (RAROC) model, implement fund transfer pricing, use dynamic interest rate risk (IRR) modeling techniques, and implement some variation of commercial loan hedging program. – All of this will help reduce the bank’s risk and increase profitability.