Get Our Favorite Fishbone Diagram in Banking to Unlock Clarity

In banking, complex problems often have many moving parts: regulatory change, technology shifts, customer behaviors, competitive dynamics, pricing pressures. It’s tempting to jump into solutioning the primary visible symptoms (e.g., “our margins are shrinking”) and assume you’ve solved the issue. But what if you’ve only tackled the tip of the iceberg?
When it comes to problem solving in banking, the fishbone diagram (also known as the Ishikawa diagram) is a simple but effective tool which is why it is one of our favorite frameworks to view and solve banking challenges. The fishbone diagram visually maps potential causes of a problem across multiple dimensions. The framework helps your team break through superficial fixes and identify deeper drivers of the problem to arrive at superior strategy or tactics.
The Fishbone Diagram Background
Back in 1943, Kaoru Ishikawa struggled with a construct to solve quality control issues in steel manufacturing. He came up with the diagram below and it gained popularity in the 1960’s, becoming a key tool for total quality control initiatives.
Since then, it has been adopted by the Six Sigma, the “5 Whys” and the “Plan-Do-Check” (PDCA) crowds. The tool is common in manufacturing and has since been applied to a variety of industries to include healthcare, marketing, human resources, and banking.
In banking, the methodology helps go beyond surface-level symptoms and consider multiple categories of possible contributing factors to a problem. By interrogating a problem with this framework, true first principles insights can be uncovered.
What is a Fishbone Diagram?
At its core: bankers start by clearly defining the problem statement or the solution they want to arrive at. They then map out the key categories of causes (“bones”) that feed into it, branching from a “spine.” Each category then branches into specific potential causes. The visual resembles a fish skeleton.
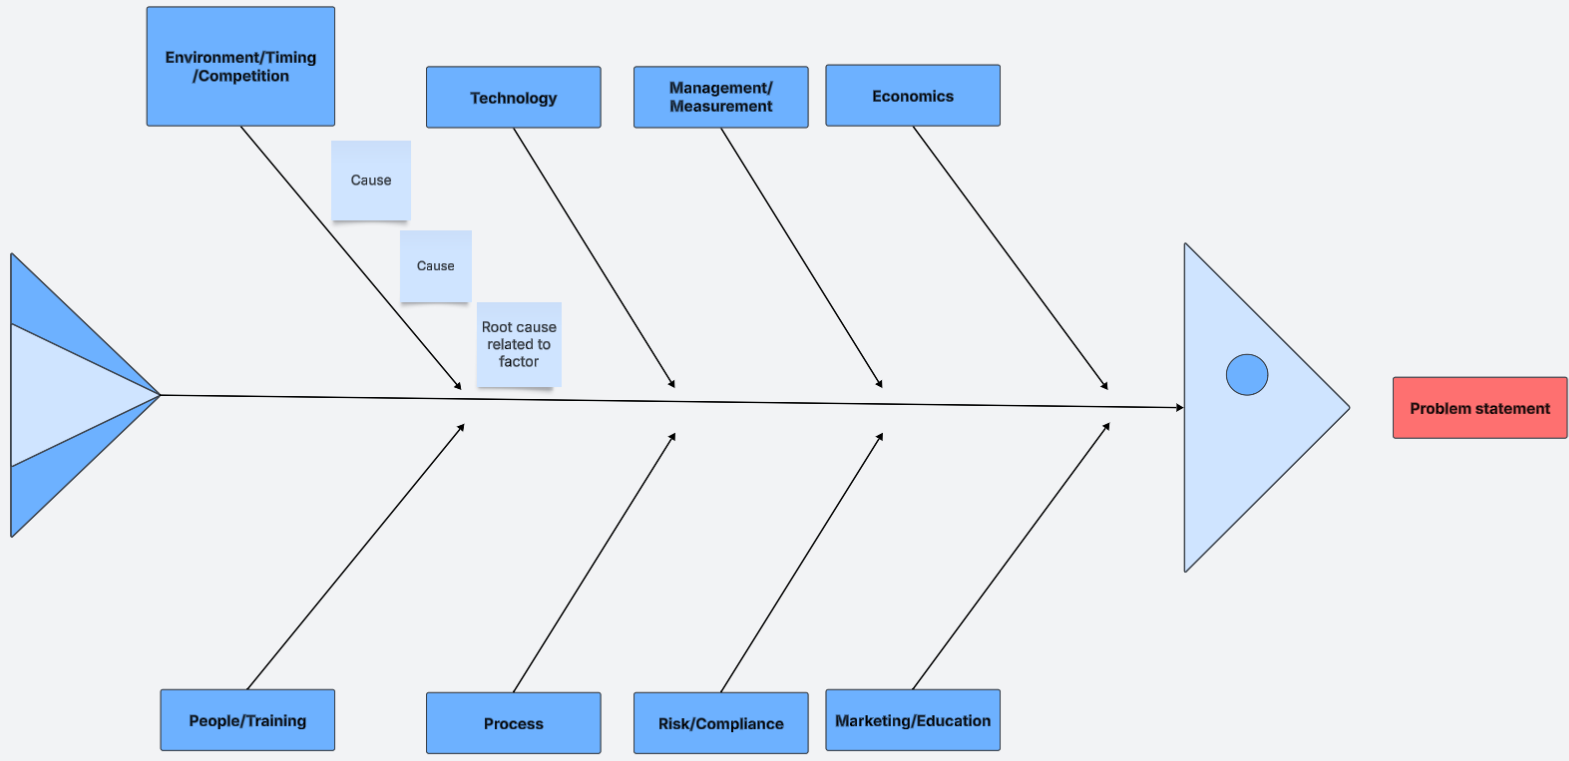
Each diagonal spine represents a cause or contributing factor. We have included some of our most popular above. Problems in banking usually result from a combination of the environment, people, processes, technology, management, risk, or economics.
You then explore each factor to determine what are the contributing factors within those categories to your problem.
For example:
- Problem: e.g., “Commercial profitability is down by 30 bps in last 12 months, a trend we want to reverse.”
- Major-cause categories: These might include People, Processes/Policies, Technology/Systems, Market/Competitive, Risk & Compliance, and Measurement/Reporting.
- Specific causes under each category: e.g., “Relationship-managers not trained on loan structuring and deposit gathering,” “Core system lacks bundled pricing ability,” “Fintech competitors attracting funds,” or “Not marketing treasury management enough.”
- From there you can use further tools (5-Whys, data collection) to probe root causes.
Get The Template
Should you be interested, we have created a downloadable template in PowerPoint form to allow you to quickly make your own fishbone diagram. Within the template, we have also provided further examples covering branch performance improvement, ACH fraud, commercial credit deterioration, customer churn, and stablecoin go-to-market acceptance.
Download template HERE.
Why Bankers Should Care
Why is this relevant for you and your bank?
- Avoid superficial fixes: Rather than “let’s just raise loan pricing,” you can explore more effective ways to increase profitability. This can be credit risk, loan term, fee income generation and/or training.
- Cross-functional clarity: There are numerous silos within banking, including Treasury, Commercial Banking, Retail, Operations, and IT that frequently lack alignment. The Fishbone provides a shared visual language to look at all units contributing factors equally.
- Data-driven truth-seeking: Once causes are mapped, bankers can move into hypothesis-testing with data (e.g., regression, control-charts) rather than relying solely on gut or historical thinking.
- Better strategy linking: When you tie causes to strategy (pricing engine upgrades, incentives redesign, risk modelling refresh) you have a clearer roadmap and more defensible positions to leadership.
- Structured brainstorming: The diagram forces thinking across domains (people, process, tech, environment) rather than leaving big holes.
How to Build a Fishbone Diagram in Your Bank
Here is a step-by-step methodology you can run with your team:
Step 1: Define the effect (problem) clearly.
Instead of vague (“profit is down”), clearly and completely define the problem (e.g., “Commercial profitability is down 30 bps in last 12 months,” or “Retail checking attrition up 15% in the Southern region.”
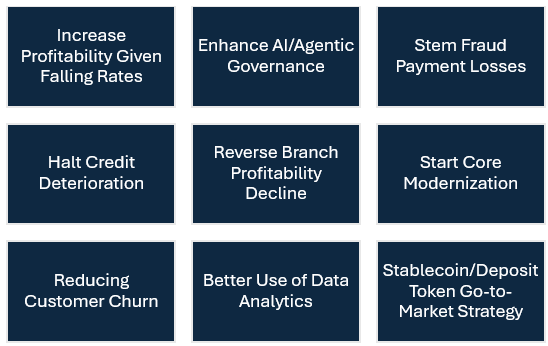
For 2026, these are some common problems ideal for solving with a fishbone diagram:
Step 2: Draw the “fish spine” and major cause-categories.
These can be anything but common categories that banks often use are below.
- Interest rate environment / External factors
- Competition
- Timing
- People, Talent, Training, & Culture
- Processes / Policies
- Technology / Systems
- Marketing
- Risk & Governance / Compliance
- Management, Measurement, Metrics & Reporting
Step 3: Brainstorm Potential Causes Under Each Category
Bring together stakeholders: branch leads, treasury, pricing desk, risk, ops, IT.
Encourage no judgement in the brainstorming; let ideas flow.
For each major category, list specific causes. For example: under “Technology/Systems” you might list “Legacy core doesn’t automate repricing” or “CRM-data not integrated with pricing engine.”
Step 4: Review, Cluster, Prioritize
Once you have the full diagram, look across for clusters or themes (e.g., many causes pointing to “lack of automation”). Then you can move into the next phase: collect relevant data, test hypotheses, identify the top 2-3 root causes with highest impact.
Step 5: Action Plan & Monitoring
Translate the diagram into prioritized actions. Figure out which cause you will tackle first, what metrics you will use and who is accountable. What is the timeline for each? Feed this into your strategic/operational plan and revisit periodically (monthly or quarterly) to monitor progress.
Step 6: Close the Loop
As you implement, update the diagram: remove causes that have been addressed, add new ones if new problems surface. The fishbone becomes a living and dynamic artefact in your management process.
Example: Commercial Deposit Profitability Erosion
Let us go back to our commercial profitability example and walk through a simplified version.
Problem: Commercial profitability is down 30 bps in last 12 months.
Major Cause Categories & Example Causes:
- People / Talent & Culture
- Relationship managers continue legacy product pricing with little segmentation.
- Lenders lack loan structuring and pricing knowledge.
- Deposit-product team lacks training on new sweep/float optimization.
- Ops turnover high resulting in service level onboarding issues.
- Processes / Policies
- Bank does not have a funds transfer pricing methodology or profitability model.
- Sales team is not bundling products and pricing to include treasury management, loans, deposits, wealth, and mortgage.
- Repricing process is slow: approval chain too long for tier changes and exception pricing handling.
- Manual processes for account pricing prevent targeted yield improvement and machine learned optimization.
- Technology / Systems
- Core banking system cannot support flex pricing tiers, or variable offer management.
- Machine learning is not used to suggest and forecast pricing.
- Data analytics lacks real-time profitability by customer and product.
- CRM doesn’t integrate with pricing engine hurting pricing optimization, cross-sell, and retention.
- Market / External Environment
- Fintech/neo-bank competitors capture high-yield commercial checking balances.
- Regional business borrowers are migrating funds to sweep/treasury-services of bigger banks.
- Interest rates are dropping but bank is not reacting quickly enough to adjust pricing and capture new balances. Deposit pricing is lagging by 30 to 45 days.
- Risk & Governance / Compliance
- Regulation (e.g., higher FDIC premiums, liquidity coverage ratio changes) increases effective cost of funds.
- Governance lacks clear margin targets by deposit segment; pricing governance is weak.
- Risk model for deposit cost does not reflect structural change in customer behavior post-COVID.
- Measurement / Metrics & Reporting
- Metrics focus on total deposit growth not net yield or margin.
- Reporting lag means cost-of-funds by segment is updated monthly, not daily/weekly.
- Dashboard missing for segment-by-segment margin erosion, so root drivers are invisible.
- Marketing and Product Development
- Current loan and deposit products are not attracting customers at our target acquisition costs.
- Marketing is not generating enough leads for growth or targeting customer retention.
- While the bank has enough brand awareness in the community it lacks product awareness.
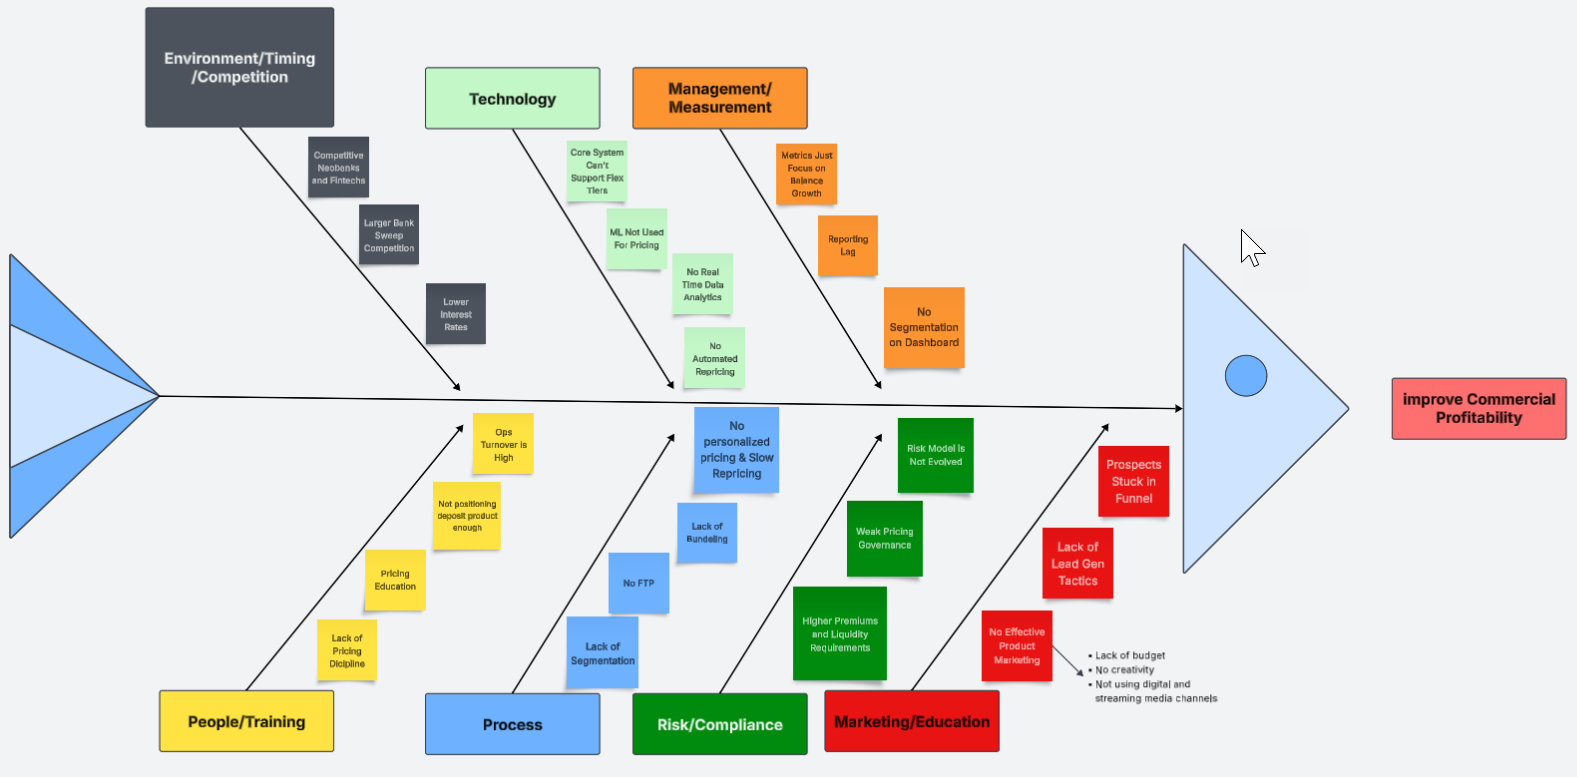
Note how you can also break down some of the root causes further such as the example above on the right for “No Effective Product Marketing.”
Once you map those out, you might find that the largest contributor is “Product offering is not attracting customers with a high enough cumulative lifetime value, and that the “Technology gap – core system doesn’t support dynamic offers or repricing” (say responsible for ~40 % of erosion). For the “Measurement gap – missing segment profitability visibility” (~30 %). Now you have targetable root causes and can craft an action plan: offering long-term fixed rate loans, getting a risk-adjusted profitability model, implement dashboard, revise policy, retrain RM team, etc.
Tips for Making It Stick in Your Bank
- Facilitate cross-functional sessions: The power of a Fishbone comes from diverse perspectives—pricing, treasury, operations, risk, IT.
- Encourage open, no-blame brainstorming: The value is in surfacing causes, not pointing fingers.
- Link to data quickly: Use the diagram as hypothesis generation, then bring in data to validate.
- Embed into your strategic review cadence: Use the fishbone as a standard tool in quarterly reviews of product or process performance.
- Keep it visible and updated: Keep the diagram circulating, update it as you make progress, and document which causes were confirmed/treated.
- Use it as a communication tool: When presenting to senior executives or the board, a well-constructed diagram offers clarity on root causes and the roadmap you’re pursuing—better than just saying “our profitability is down.”
- Don’t over-complicate: Start simple. You don’t need 100 causes. Focus on those with high impact and ease of measurement.
Putting This into Action
In an era rapidly changing innovation such as the introduction of artificial intelligence, stablecoin, tokenized deposits, instant payments plus the added pressure from fintech competition and general economic uncertainty, having this tool allows banks better clarity around problem solutions. The fishbone diagram is likely to become one of your most effective tools that will be ingrained into your culture. It helps transform “we’re not making our cost of capital” into “here are the five root causes, backed by data, we’ll fix them in Q3-Q4” to produce an 15% return on equity.
Deploy it. Keep the diagram alive. Use it to bring clarity to your next strategic planning session. Your executive team will thank you.