Use This Trick To Better Diversify Your Loan Portfolio

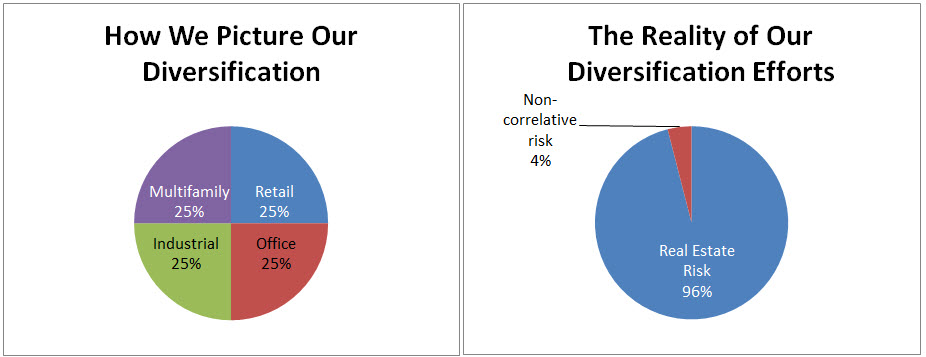
You can slice and dice your credit portfolio all you want, but if you are not paying attention to cross-correlations, your efforts could be sub-optimal. For example, many banks separate their multifamily exposure away from their single-family exposure. In some markets, these two subsectors are almost 80% correlated. A drop in housing prices usually occurs at the same time as a drop in multifamily values. Delinquencies usually move in lockstep. While segmenting your portfolio may serve to check a regulatory box and may help to comfort management, banks should not draw too much solace. In this post, we explore the top customer segments that have been found to help true diversification.
Separating Risk And Correlations
It is important to recognize the difference between risk and correlations. A sector can be risky and still present a low or negative correlation to the rest of a bank’s portfolio. For example, loans which are tied to the performance of alternative energy, such as solar, are risky given their default history and cash flow volatility but are one of the major lending sectors that exhibit very little correlation to the general economy. Thus, a bank that structures and prices this risk right helps offset the volatility, and adding it to the general portfolio serves to decrease the risk of the overall portfolio. In this manner, one plus one can be less than two.
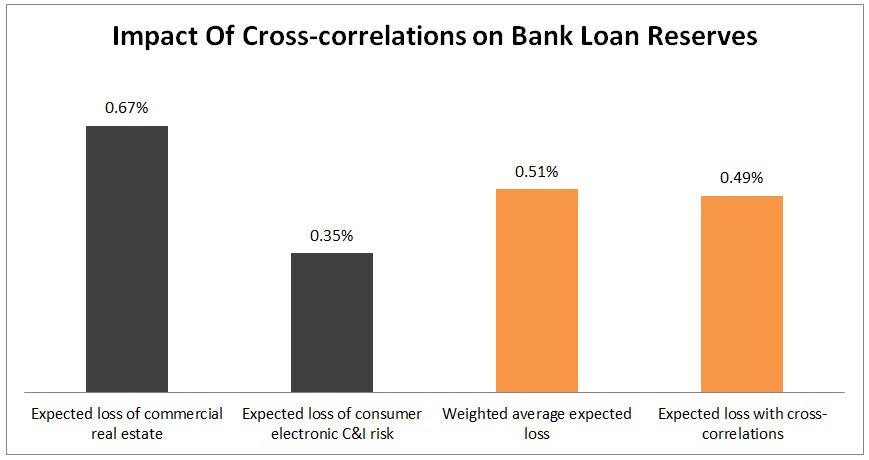
This misunderstanding has often gotten in the way of properly understanding and putting into practice the utilization of cross-correlations when designing a bank credit portfolio. In the example above, when you combine equal exposure of commercial real estate (CRE) and commercial loan to a consumer electronics company, the average weighted expected loss is 51 basis points in our example. However, because these risks have low correlations to each other, they help offset each other’s risk. Real estate tends to follow the general economy while consumer electronics do not. As such, when the expected loss increases for CRE, the odds are that the expected loss for the consumer electronic firms does not. Thus, on average, the combined expected loss is less than the weighted average by about two basis points in our example.
Our Top 25 Low Correlative Industries
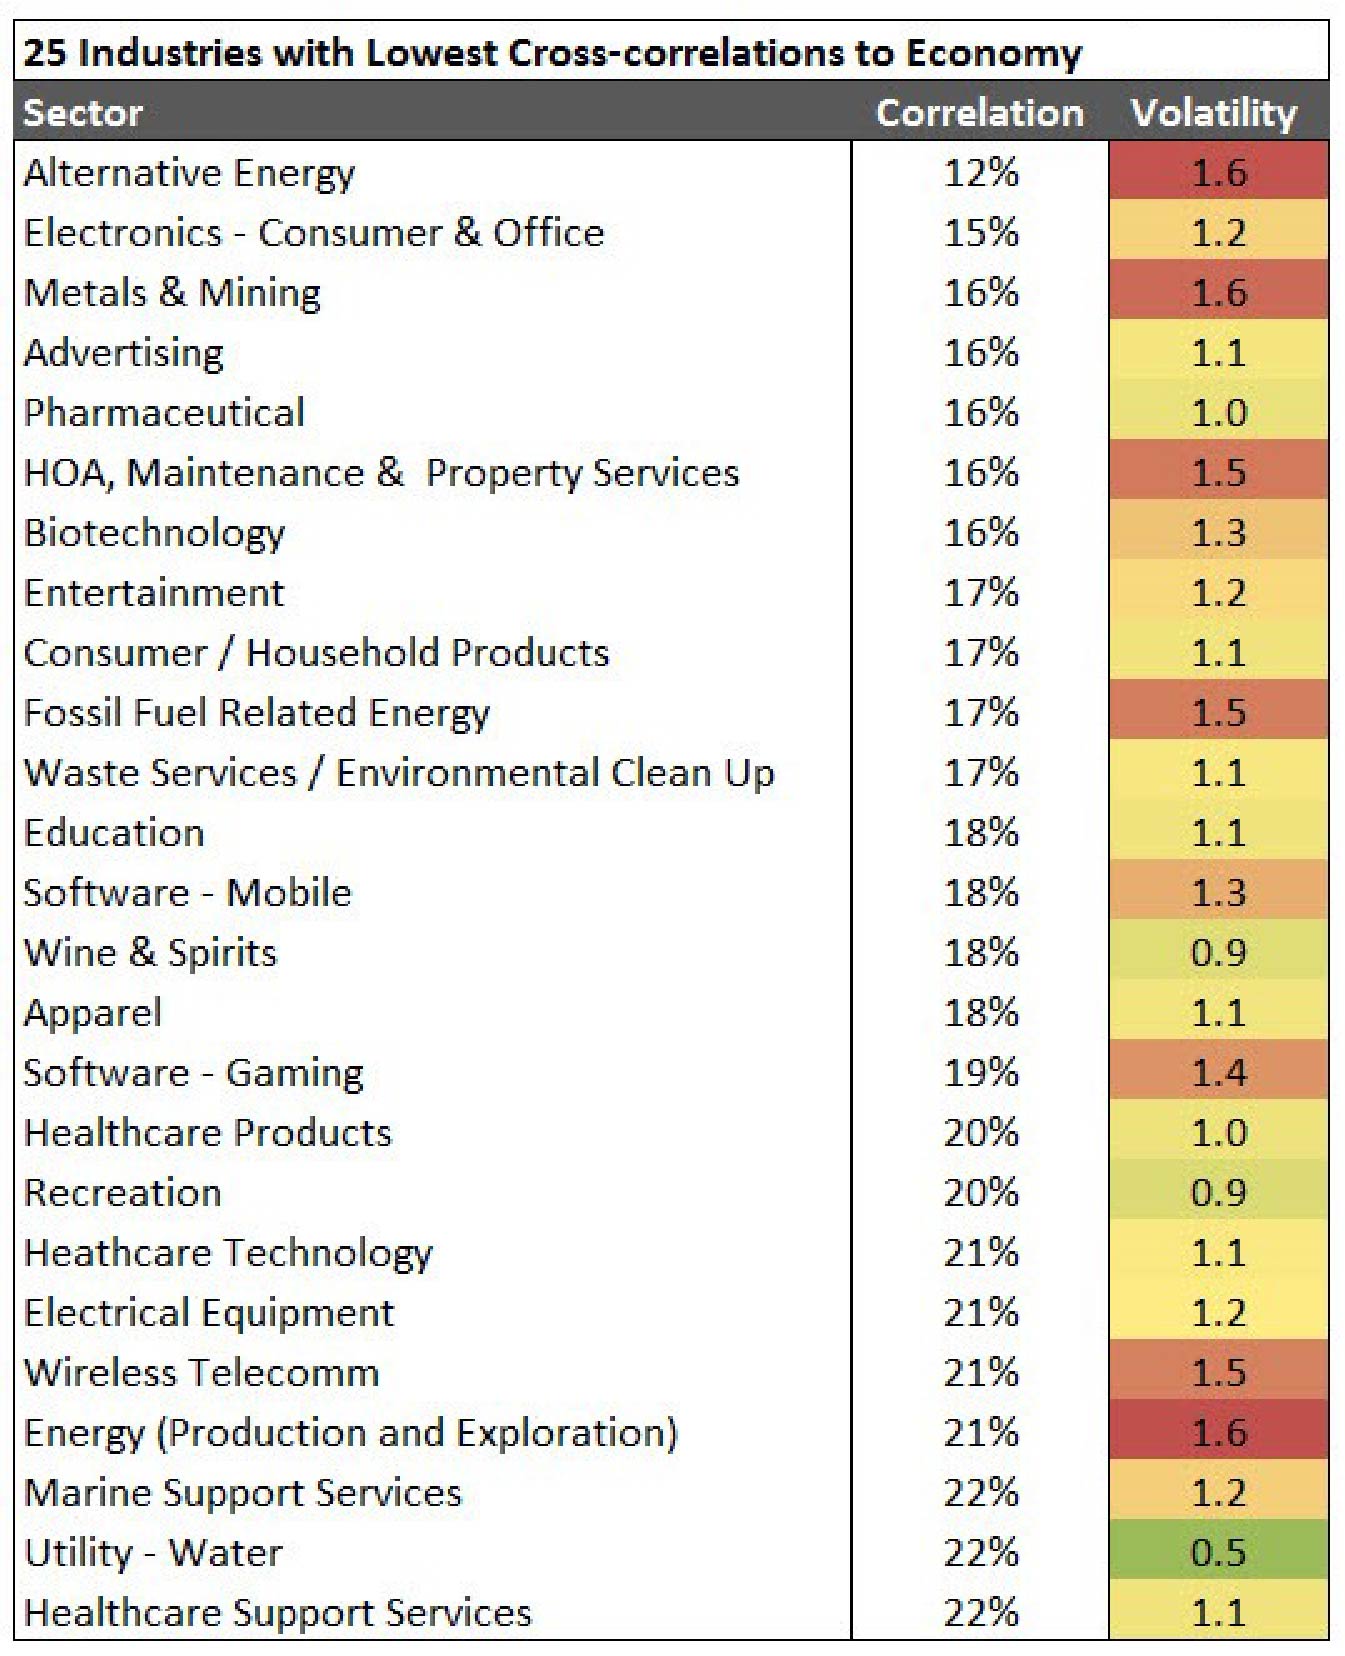
Here is our research on the cash flow and market capitalization of the 25 industries that have the lowest correlations to the general economy. While we get specific, in general, healthcare, technology, consumer products, agriculture, food, and telecommunications are industries that are not highly correlated to either the general economy or real estate.
This means that we can adjust pricing and structure to be more attractive to these focused industries. It also means that we can have more of a sales effort and be more tactical in our marketing. The more we bank schools, water utilities, or technology firms, the more exposure we can handle in real estate. Alternatively, the other way to look at this is the lower our cross-correlations are across our credit portfolio, the fewer reserves and/or capital we need to hold.
Below is a list of our top 25 sectors with the lowest correlations to the general economy. In addition, we have included a volatility measure as a proxy for risk letting you know what areas you might need to move with caution on.
Diversification Within A Sector
The same is true for correlations within a sector such as commercial real estate. The reality is many real estate sub-sectors move together and offer little in the way of diversification. When the economy turns, tenants aren’t looking for new office space any more than they are looking for new industrial space.
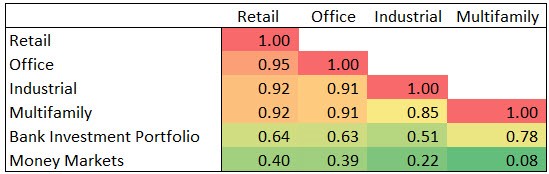
Take a typical bank commercial real estate portfolio. The below matrix is composed of 10Ys worth of loan valuation data and shows that most bank-related real estate sectors move in lockstep with each other. Banks like to add office loans because they think the move offers diversification to retail loans. The reality is that office loans, and retail loans are 95% correlated. Bankers are careful to add multifamily exposure to their commercial real estate holdings, but the reality is that loans on apartment buildings are about 88% correlated to the rest of a bank’s commercial loan portfolio.
Diversification on a Balance Sheet Basis
Prior to the 1980s, it was a standard target for banks to hold 25% of their assets in Treasury securities. While the yield was relatively pitiful, when the economy went into a recession, falling rates caused these quality fixed-rate securities to gain in value offsetting the drop in value of the bank’s loans that suffered in credit quality.
These days, banks have moved into securities with greater risk often taking on credit, optionality or liquidity risk in exchange for yield. While this helps earnings, it is done at the altar of diversification as investments with those additional risks are more correlated to a bank’s loan portfolio. While there is nothing wrong with any of these asset classes, our point here today is the need to design your balance sheet instead of letting your balance sheet design the bank. As a rule of thumb, the more correlative risk you have in your loan portfolio, the larger your low-credit risk, low-optionality, and high-liquidity investment portfolio your bank should have.
For commercial real estate, one trick that some banks do is to spend more resources diversifying their real estate portfolio by geography. Different geographical markets, and market types such as metro, suburban or rural, tend to be less correlative than sub-sector types (as the pandemic experience has reinforced). Instead of correlation in the 90%-range, you end up achieving correlations in the 70%-range depending on the market.
Putting Cross-correlations Into Action
Banks should attempt to correlate income, property values, market values, and geography to understand how various sectors interact with each other. By changing pricing, sales/marketing resources, and underwriting standards based on geography and industry, instead of the sector, banks can achieve a better risk/reward profile than banks that manage by sector.
There are market indices such as commercial real estate REITs, transportation, utility, and others that can at least get your credit team in the right ballpark of how different sectors move together. Bankers can use the industries that are applicable to the bank, and as long as your data is representative and homogenous enough, bankers can create a correlation matrix in Excel (using the “correl” function) in order to view the relationship of every sector on every other sector. In this manner, lending and credit teams can focus on those sectors with low correlations. Weigh each sector by the outstanding loan amount and apply the cross-correlations, and bankers now have a more sophisticated tool for managing their loan portfolio.
Breaking your credit portfolio into various loan types is interesting but may not be instructive enough to serve to manage risk. Understand and construct your loan portfolio using correlation analysis, and your bank can gain a significant strategic advantage against community banks that are not paying attention to how their credit risks align.