Using Decision Trees in Banking (And Why Innovation Makes Economic Sense)

If you are looking to make best-in-class decisions, it pays to have a variety of best-in-class tools at your disposal. Oftentimes, a reason why banks don’t innovate more is that they lack the tools and experience to properly understand the risk and the return. Without a way to quantify the risk, stagnation occurs. As banks develop their risk management culture, it pays to have all managers conversant in the proper tools to manage risk. Today, we highlight a helpful tool that your bank may want to train on in order to improve its decision-making and risk management framework. Today, we tackle the decision tree.
Many risks in banking are not only discrete but also sequential. Innovating a new product is one example of this. A bank invests in a new product with failure translating into a potential complete loss in value. A new banking product must be developed, tested, pass compliance / regulatory review, proven not to cause problems with other products, and then be accepted into the marketplace. A failure at any stage will, at best, cost more money while, at worst, will result in complete failure. Decision trees allow banks to quantify the upside and downside at each phase while providing banks with a decision-making framework to make decisions once the project starts.
Decision Tree Concepts
Part of the wonder of decision trees is that they are flexible and can be used anytime there is a sequence of events. The decision tree, while seemingly simple, is often used in advanced mathematics and has undergone a resurgence with the rise of artificial intelligence programming. That said, the basic application is relatively simple. The first step to understanding this methodology is to understand the basics:
Root Node: The root node is the start of the process from which all other decisions emanate. The entire tree answers the question – given the uncertainty, what is the value of certain decisions.
Event Node: Event nodes represent outcomes when faced with uncertainty. A bank that is developing a new lockbox application, for instance, has the potential events of spending $80k to develop the product only never to get it off the ground, or to spend $150k and have a large hit on their hands that results in $1mm of fee and deposit value.
Decision Node: The decision node represents the choices that a bank can make – for instance, expanding the beta test for the lockbox application. The bank will know how the application did on its beta test and then make a decision to move to a national market. Already, one can see the usefulness of this framework as the natural question to the above structure is – what needs to occur in beta to warrant a national rollout? Creating a decision tree helps define each stage so everyone, from staff to the regulators, are on the same page when it comes to sequential decisions like product development.
End Nodes: The end nodes represent the outcome of an event. In the example above, while the event was a national introduction, one end node was $1mm in fees and deposit value, while a complete failure would have the bank writing off their entire $150k investment.
Developing a decision tree also requires banks to go through and define each step so that each phase is diagramed. To put this into practice, the following needs to be understood:
Break Down the Process: While developing a product encompasses many steps, banks want to group phases by the nature of the activity. Activities should be grouped together that are between a decision point. Each decision point will mark the end of one phase and the start of the next.
Define the Decision: At the end of each phase, a decision point occurs where the project team must decide all the options available. For example, in rolling out a new lockbox product, one phase of the project might be to test market. Here the decision points are: a) Move directly to a full product rollout; b) abandon the product; c) conduct a second market test; or d) modify the product and conduct a second market test.
Estimate Probabilities: Once a phase has been defined and the events understood, the project team must do their best to assign probabilities to the outcome. This can be based on past experience, other bank’s experience, or simply an educated guess. While you will not be accurate, the idea is to just get close. The probabilities of each outcome must add up to one, and each outcome must take into account the previous outcomes. For example, the amount of customer penetration with a full rollout may depend on how well the test marketing went.
Compute Cash Flow: At each node, the net cash flow must be estimated up to that point. For example, in the case of a failed test and then an abandoned product, the net cash flow is the total cost of the product minus whatever revenue was achieved in test marketing. In the case of a successful launch, then it is the total revenue of the expected usage minus the cost of development.
Fold Back the Tree: The final and critical step is to calculate the value of each path. This is called “folding back the tree” and means that you start at the end of each branch and then multiply the end cash flow by the probability of that outcome, so the end result of each node is the weighted average expected value of all possible outcomes. In cases where there is a decision point, then the highest value decision is chosen since that will be the optimized path.
The end result of folding back the tree is that you get the expected value for the entire product development process. This value incorporates both the upside and downside of each phase of the process along the way. This is just like determining the risk-adjusted value of a loan, as now you have the risk-adjusted value of the multiple decisions and outcomes that make up a sequential process.
A Product Innovation Example
Let’s more fully explore our lockbox example. Let’s say that you have a weak lockbox option from a vendor, and you need to make a decision on how to upgrade the product. You can keep the product as it is, improve the process by adding part-time staff or develop the product on your own. If you develop the product on your own, you can do this on a minimal basis, or you can fully develop the product.
We then assign development phases, decisions, the probabilities of different market reactions, and the estimated cost and revenue of each end node. For the sake of simplicity, we just looked at a two-year time horizon (one year of development and one year of introduction) and will ignore discounting the cash flows. If this was a real example, we would look at the product’s useful life (typically three years for software applications) and create three periods of cash flows and then discount that back at our cost of capital (about 10%). For this example, the outcome will be the same, so for illustrative purposes, we simplified the logic in the decision tree below:
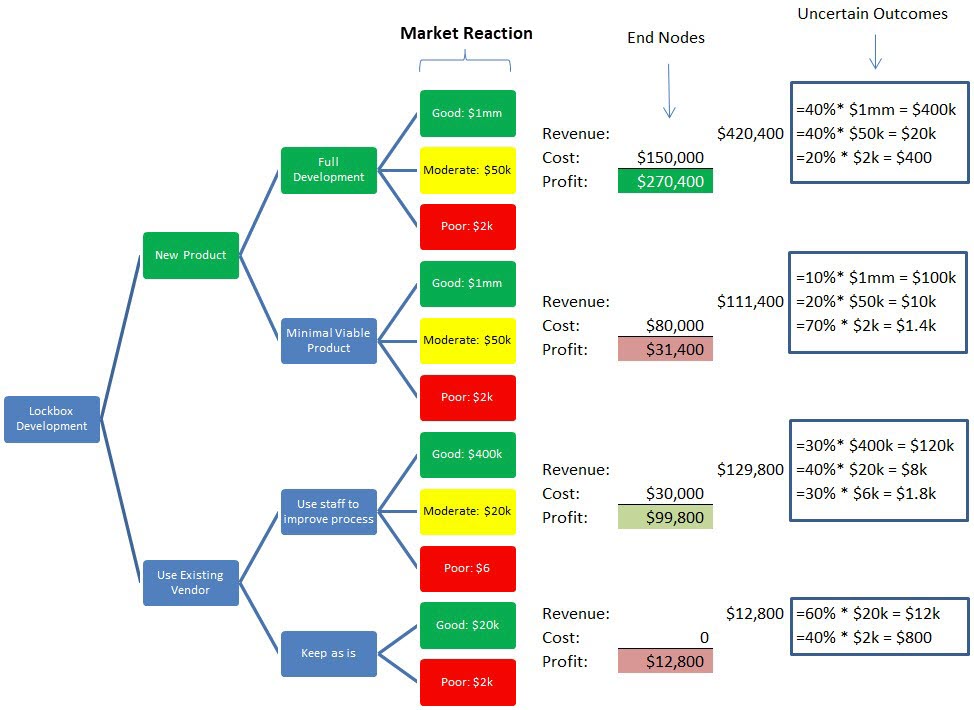
As can be seen above, we calculated the expected value of each path by taking the endpoint of the market reaction and multiplying it by the probability. We sum these expected values to get a total expected value for the complete branch. This is one layer folded back. If this was a real-world example, we would keep doing that in the case where you had more phases (such as a development and beta test phase).
What emerges is a risk-adjusted expected value of each decision. As you can see, our best return of 180.3% is to build out the application ourselves and replace the vendor with better, more updated technology. This optimized path is highlighted in green.
180% Return?
As an aside, we want to put out that this is a real-world example from a bank that faced this very decision. We have changed the numbers slightly to protect the innocent, but the result is still the same. Keep in mind that this is a conservative calculation, as we just included one year of cash flow. The return numbers would be much better.
We point out that this is the type of investment opportunity that banks now face every day. Banks have a huge advantage in that they understand the process and already have a base customer segment to help test and pay for the product. This de-risks much of the decision and is entirely different than the decision tree that a fintech start-up might face. A fintech may only possess a basic understanding of the process and the technology know-how (which can be purchased or acquired by a bank). Getting a 180% risk-adjusted return is likely better than any deposit, lending, or other fee lines that a bank might face. It is head-and-shoulders better than any capital restructuring decision a bank could make, such as paying a dividend or buying back stock.
Uses of Decision Trees
The same decision tree can be used to open a new branch (don’t expect the return above), start a new asset-based lending line, or go after a new customer segment. To that point, if you are thinking of opening up a branch, we challenge you to try to come out with a positive number using a decision tree framework for anything less than a ten-year time horizon (and even then, it is more than likely that you will still come up with a negative number). Despite the potential negative expected value, banks make branch opening decisions every month, never looking at the actual risk. Using and getting comfortable with a decision tree framework may open up your eyes to the real risk of each decision which, in turn, will help you make better best-in-class decisions.