
See Your Bank Peer Group Forensic Data [Free Tool]

Over the past two weeks, we presented the latest 2Q 2026 data to showcase each bank’s peer group analysis (HERE) and analysis around the “Flaw of Averages” (HERE) to help banks choose the right median or average to compare themselves to. In this article, we look at the bank peer group forensics behind the analysis to help banks turn the data into more action and to provide greater context to the results.
How to Drive More Context From Bank Peer Group Data
Most bank performance conversations begin with questions such as:
- Why is our ROE lagging peers?
- Are we carrying too much capital?
- How can we improve our funding mix?
- Are we being compensated for the risks we are taking?
- Where should management focus first to drive performance?
The real value of forensic-style bank analytics is not that it produces more ratios. The value is that it converts thousands of Call Report data points into a coherent strategic narrative. Using SouthState Bank as an example, let’s walk through six key analytical views and examine the questions every executive team should be asking about its own institution.
Follow Along
Like our past two interactive articles, you can follow along by pulling up your bank, modifying the peer group, and then seeing how your bank performs and compares. If you are a bank, click below to access our Bank Forensics (and other tools).
The tool featured in this article lives in our free portal, next to the resources, dashboards, and calculators that over a thousand community banks use to make sharper decisions.You've read the article. Now use the tool.
Overview: Your Bank’s Report Card
The first stop is the Overview tab which serves as the executive dashboard. At first glance, it answers a fundamental question, “How healthy is this bank relative to peers?”
In the Forensics application, you can see what metrics keep you ahead, at or behind your peer group. Many banks spend significant time discussing whether a 1.2% or 1.4% ROA is good. The better question is, How does our ROA compare against institutions with similar strategy, size, and business models? The Overview page begins answering that question by translating complex performance data into an executive scorecard.
The GPA-style rating is particularly useful because it reveals whether performance is balanced or dependent on one or two strengths.
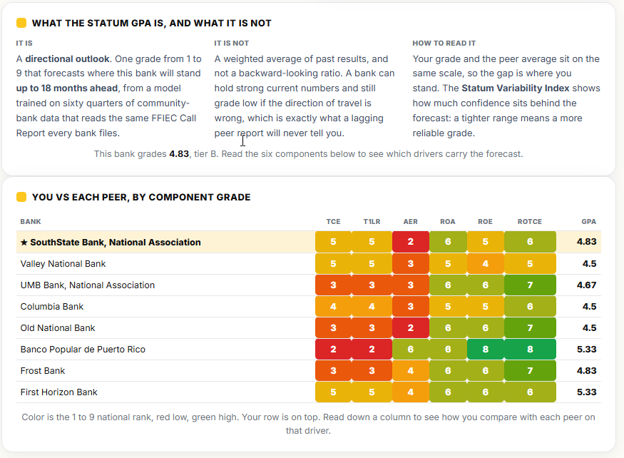
For example, a bank may have strong capital but weak earnings. Another bank may have stellar profitability but excessive concentration risk. A third may have healthy credit quality but an inefficient operating structure.
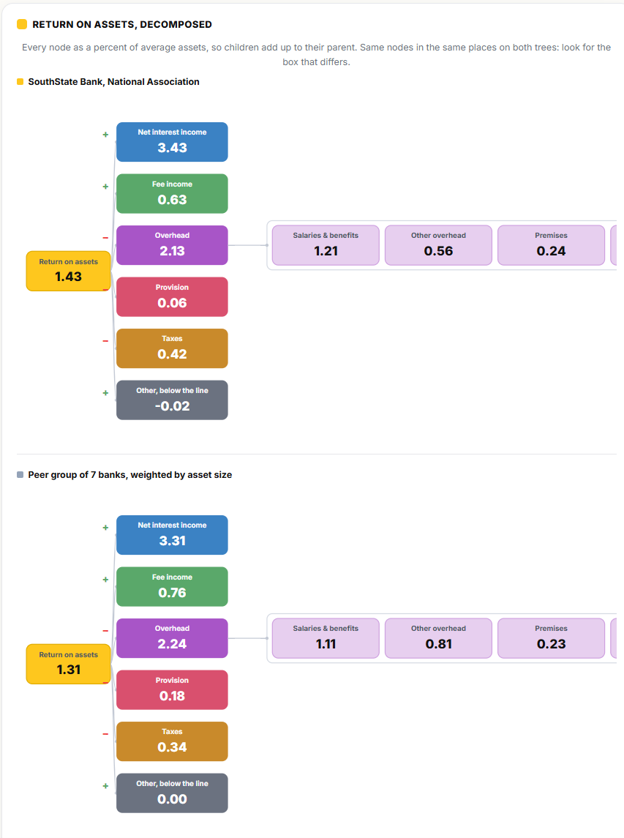
Using the set of Du Pont charts, bank management can drill down and see the composition of earnings and how it compares to a peer group. Bankers can compare how their credit charges, salaries, premise expense, and other items stack up.
Earnings: Following Every Dollar
While ROA and ROE are important, the more important aspect of benchmarking is understanding what factors can be improved upon or protected. The Earnings tab breaks profitability into its component parts, revealing exactly where the institution earns, spends, and loses money.
We love a Sankey chart, and one of the most powerful visualizations is “Where Every Dollar Went.”
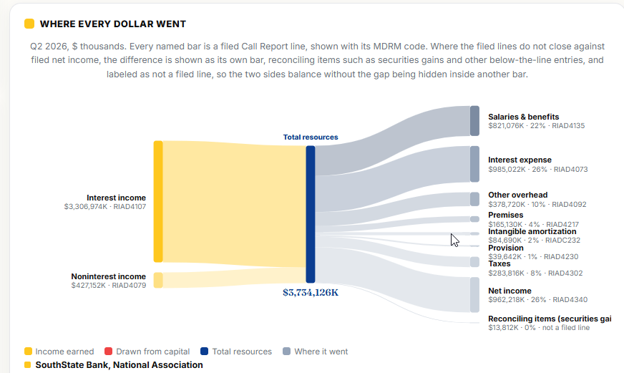
Instead of simply reporting net income, executives can see the relative contribution and impact of Interest income, fee income, salary/ benefit expense, interest expense, occupancy, operating expenses, taxes, and provisions.
You can compare your bank to peers and see how different expense philosophies impact the business model. Some banks spend more on salaries while other spend more on branches. Often, spending less on salaries mean worse product performance, making deposits more expensive.
This level of visibility allows management teams to answer a question every board eventually asks – “What actually drives our profitability?”
In the SouthState example, net Interest Margin exceeds peers, efficiency is stronger than peers, and ROA is slightly above peers.
That data story immediately creates a hypothesis, and we can deduce that revenue generation is not the issue, nor is expense management. Something else is influencing shareholder returns. Without decomposition analysis, that insight might be missed entirely.
The Earnings section helps identifies where differences originate. In SouthState’s example, “Other Overhead” is meaningfully lower than peer levels.
That observation can lead executives to ask, are there best practices worth preserving? Can those efficiencies scale as the bank grows? Are peers investing more aggressively in growth initiatives?
Rather than simply reporting a ratio, the platform points management toward actionable conversations.
Capital: The Balance Between Strength and Performance
Many bankers instinctively view capital as a defensive metric. Regulators certainly do. Investors often do not. The Capital tab reframes capital as a strategic asset.
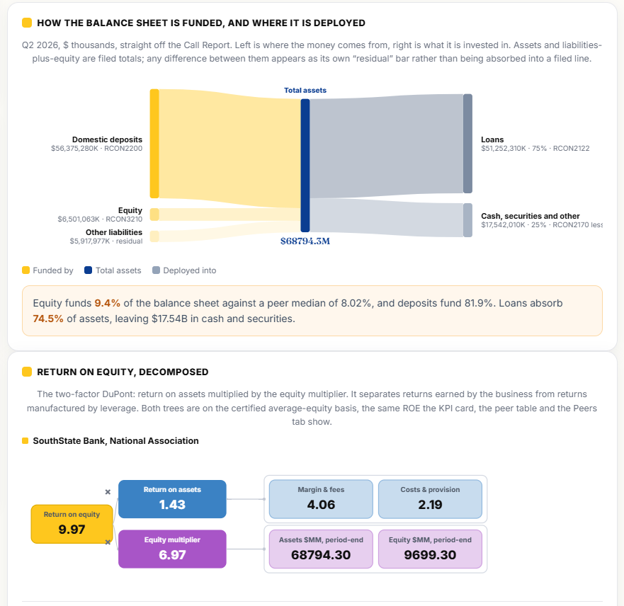
SouthState’s example highlights that we have tangible common equity (TCE) of 9.45% and Tier 1 Leverage of 10.28%. Those are healthy capital levels. The question becomes, is this the right amount of capital?
The Return on Equity decomposition is particularly insightful.
ROE is broken into: ROA × Equity Multiplier. That seemingly simple formula helps explain one of the most common challenges facing regional banks today. Many institutions generate respectable operating returns but carry significantly more capital than peers.
In SouthState’s case, like many banks, the analysis suggests that earnings are being generated on a relatively larger capital base.
That is not necessarily bad.
But it creates strategic decisions about what you should do with the excess capital. It also provides you a way to understand what the cost of that excess capital is. A greater investment in AI, M&A, share repurchases or a dividend strategy should all be discussed with excess capital with the question of what will generate the greater shareholder return.
The Capital section transforms regulatory ratios into board-level strategic discussions along with allowing you to compare balance sheet composition to different banks in Sankey, graphical form.
Asset Quality: Looking Beyond Today’s Credit Metrics
Most credit discussions focus on recent performance. Yet experienced bankers know today’s losses usually reflect decisions made years earlier. More importantly, since a bank is eight to ten times leveraged, every credit view is amplified.
The Asset Quality tab provides a broader assessment of risk. Here you can see how asset quality compares to your peers and peer medians.
Of interesting note that is hard to compare in other systems, banks can see their CRE concentration compared to the peer median. Again, this is where contextual analysis matters.
A concentration ratio alone cannot determine risk. However, since the regulators look at it, it does merit the question over do you have enough diversification? Is this concentration intentional, or because you have not gotten around to developing your C&I credit and lending team? If you do have a concentration, are reserves aligned with portfolio composition? What happens under a stressed economic scenario?
The asset quality analysis is valuable because it forces management teams to connect performance and risk. Many troubled institutions reported excellent credit quality right before experiencing deterioration. The strongest banks continuously evaluate emerging vulnerabilities while credit metrics remain healthy.
This tab supports exactly that type of forward-looking discussion.
Liquidity & Funding: Can the Franchise Fund Its Growth?
This is our favorite section as we are huge fans of driving franchise value through deposits. For much of the past decade, liquidity management was relatively straightforward.
This current rate cycle changed everything. Today, funding often determines competitive advantage and how you position your balance sheet will have an impact for years to come. Last year, many banks anticipated several interest rate cuts by the Fed only to be faced with several raises and longer than desired asset duration.
Making matters worse is that many banks are growing faster than their deposits, which further puts pressure on funding costs.
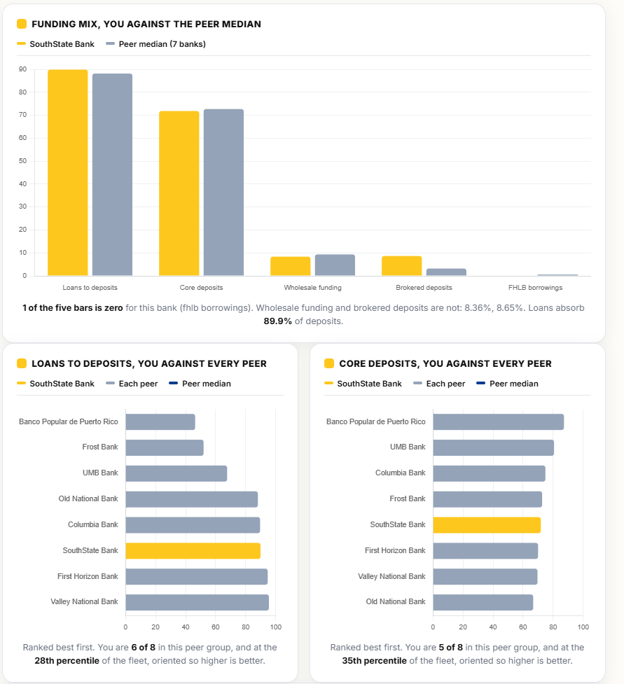
The Liquidity & Funding section may be one of the most strategically important views available. It is important to understand where your bank derives its funding and how it stacks up to competitors that are in the market that price off their funding cost.
The funding mix comparison against peers is particularly useful. Two banks may report identical asset growth. Yet one may have achieved growth through stable operating deposits, while another funded growth through expensive wholesale sources.
The financial statements alone often fail to tell that story. Funding composition analysis reveals it immediately. For executive teams preparing strategic plans, this section can guide decisions regarding:
- Treasury management expansion – payments, tokenized deposits, etc.
- Commercial deposit acquisition & product development
- Pricing discipline
- Wholesale funding limits
- Liquidity contingency planning
Put simply:
Growth without funding strategy eventually becomes a profitability problem.
Sensitivity: Understanding the Economics of Your Franchise
Arguably the most fascinating section is Sensitivity. Traditional bank analysis often explains what happened. Sensitivity analysis explains why.
The featured measurement is Deposit Beta.
For executives unfamiliar with the concept, deposit beta measures how much an interest rate increase is passed through to depositors.
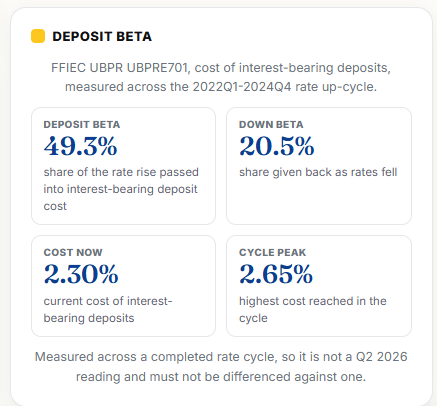
SouthState’s example shows:
- Deposit Beta: 49.3%
- Down Beta: 20.5%
These figures describe the short-term economic behavior of the deposit franchise.
That information can be extraordinarily valuable. Consider two banks with identical balances. One passes through nearly every Federal Reserve rate increase. The other preserves pricing discipline and retains more spread. Both report the same deposits. Only one possesses a stronger funding franchise.
It is rare that you have seen the deposit beta for non-public competitors. Deposit beta provides insight into:
- Pricing effectiveness
- Customer behavior
- Franchise quality
- Future margin resilience
Combined with:
- Cost of funds
- Loan yields
- Net interest margin
- Efficiency ratios
Executives gain a much clearer view of earnings sustainability. This is particularly important as the industry navigates future interest rate uncertainty. The banks that understand their deposit behavior will likely outperform those that simply react to market changes.
From Financial Reporting to Strategic Intelligence
The greatest value of analytical platforms is not the visualization. It is not the dashboards. It is not even the peer comparisons. The true value lies in helping leadership teams ask better questions. This tool helps bankers understand more about their bank and about their alternatives. Bankers can now better understand how a bank can move beyond static ratios and begin understanding the interconnected drivers of performance.
A strong ROA means little without understanding funding costs. Strong capital means little if returns lag peers. Good credit quality means little if concentrations create future vulnerabilities. Robust liquidity means little if deposit pricing destroys margin.
Every bank already files the information needed to diagnose performance. The opportunity is to transform that information into action. That is where real competitive advantage begins.
The tool featured in this article lives in our free portal, next to the resources, dashboards, and calculators that over a thousand community banks use to make sharper decisions.You've read the article. Now use the tool.