The Data on Better Credit Diversification
Most banks are concerned with their credit portfolio. As credit risk increases with rising rates, the following question arises – is it better to diversify by geography, property type, or business type? Do you focus your marketing dollars and pricing on particular counties, commuter zones, types of commercial real estate loans, or specific C&I industries? The answers may not be so apparent and vary for each bank. This article provides data and a framework for helping bank risk managers decide how to deploy capital best.
Credit Diversification By Geography
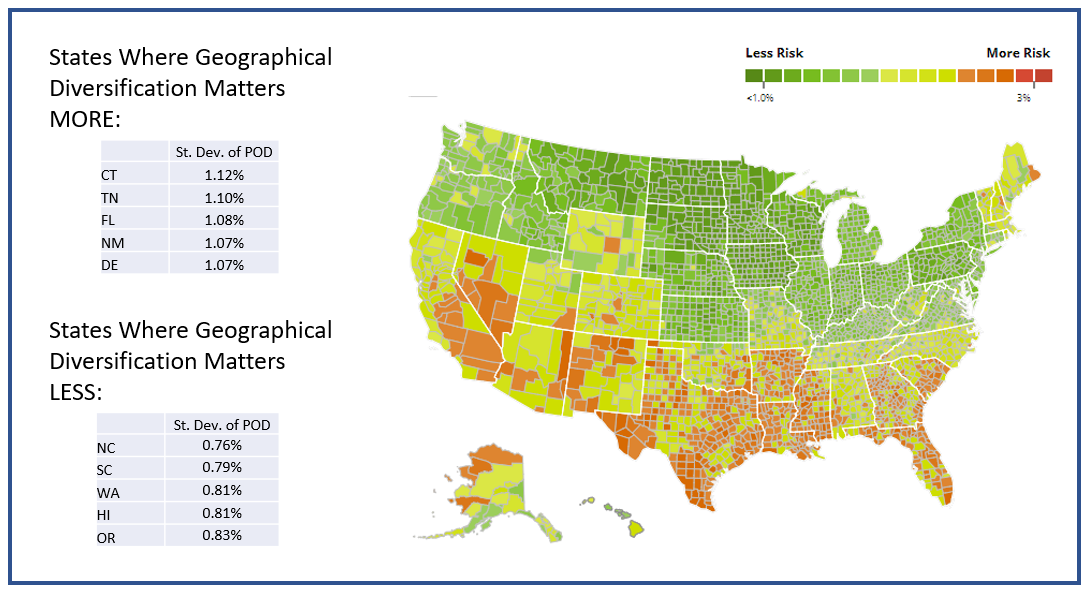
For the first part of the analysis, we look at geography both by county level and commuter zone performance (commuter zone analysis HERE). We leverage PayNet data that supplies probabilities of defaults. Some states, such as Connecticut and Tennessee, have diverse enough economies where allocation of capital to different areas makes sense. Other states are more homogenous as to credit, where geographical diversification has less impact. As a general rule, geographical diversification has become more critical during and after the pandemic due to the impact of Covid and its related political mandates.
Florida is a good example. Miami-Dade County has one of the highest annual probabilities of default (POD) in the State at 1.74%. A short drive to the north from Miami-Dade is Martin County, with one of the lowest default probabilities in the State at 1.52%, or a 15% difference. More importantly, the correlation of PODs between the two counties is a relatively low 45%. Thus, adjusting pricing and structure for risk would gain some portfolio diversification from lending to both counties.

In comparison, states such as NC, SC, WA, HI, OR, and MI have relatively low differences in PODs and have high correlations across geographical areas. The state of Washington, for example, has about a third of the standard deviation between counties and commuter zones when compared to Florida (graphic below). In addition, the cross-correlations between areas average in the 75% range. Thus, geographical diversification gains you little if you are a bank in these states and try to lend to different counties.
Credit Diversification By Loan Type
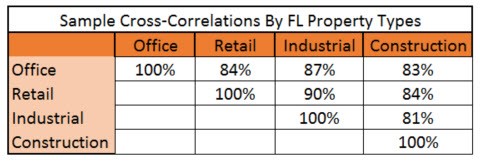
Next, we consider defaults and correlations by loan type. For simplicity, let’s focus just on commercial real estate. As can be seen below, commercial real estate is highly correlative. That is to say that the PODs tend to move in lockstep with each other. Whereas different geographies are 75% correlated across a state, commercial real estate is about 86% correlated.

Given the data above, the preliminary conclusion is that it is better to diversify geography than the sub-loan type if you are in a diverse state. That said, consider a couple of items:
Targeted Sub-types: The above analysis assumes we are trying to diversify across all sub-types within a sector. However, if we target just a few, such as the retail sector, even though it has higher PODs, the correlation to the rest of the portfolios is in the low 80%s. Agriculture has a relatively low probabilities of defaults AND low cross-correlations, making it an excellent sector for diversification. Diversifying across sectors might offer greater credit diversification than geography in certain areas.
Contiguous Geographies: If a bank is large enough to have the ability to lend throughout a state, then the above analysis may be pertinent. However, suppose a bank is smaller and constrained to a limited number of counties or commuter zones. In that case, the opposite conclusion might be reached – diversification might be better achieved through loan type.
Asset Class: For the sake of simplicity and commonality, we did not include all asset classes such as consumer lines, leases, and other lending alternatives. Lending lines such as credit cards, autos, student loans, municipal lending, and equipment leases tend to have more diversification in PODs and have lower cross-correlations. In FL, across all bank asset classes, cross-correlations are approximately 65%. Thus, to the extent a bank can lend to both commercial and retail, diversification within a state can be enhanced.
Credit Diversification By Industry
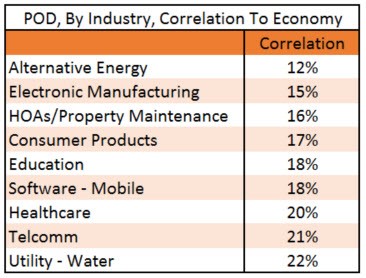
Finally, banks can diversify credit as to the type of industry. Banks can diversify by industry either through loans to a business or loans to a commercial real estate property leased to a single sector. This is the huge advantage that C&I loans have over other lending lines. They are often more profitable than consumer lines due to their large size and can achieve better diversification than almost any other bank alternative. As can be seen below, cross-correlations in the 20% range are common. The more geographically dispersed a business’ revenue stream is, the better diversification a bank can achieve.

Putting This Into Action
As a general statement, banks don’t have enough intent when designing their credit portfolio. The power to adjust pricing, structure, sales, and marketing resources to achieve greater diversification is often underappreciated and underutilized. Banks need to pay attention to geography, asset class, loan type, and industry to achieve a balance sheet with the highest risk-adjusted return over a business cycle.
If you are in a diversified state and have access to multiple counties, that is an easy place to start setting targets by county or commuter zones. Next, specialize in an industry such as homeowner’s associations (HOAs), alternative energy, education, or consumer products and scale state or region-wide. After that, concentrate on asset class on your balance sheet and leverage lines of business such as agriculture, consumer lines, and specialty finance. After all that, fine-tune each asset class as you add various loan sub-types.
By having intent when constructing your balance sheet, banks can make 1 + 1 = >2. Proper diversification allows banks to achieve their current return, taking on just a portion of their present risk. True diversification will help insulate the bank as the economy changes or shocks hit specific sectors.

