How to Manage the Cost of Funding Dilemma for 2025

The banking industry’s cost of funding earning assets (COF) is highly correlated to short-term interest rates. The Federal Reserve lowered short-term rates by 100bps in late 2024, with expectations of additional rate cuts in 2025. On average, community banks have not been able to lower their COF, now recognize the reality of a pause by the Federal Reserve, and the possibility that the next Fed action is a hike instead of a cut.
The Cost of Funding Data
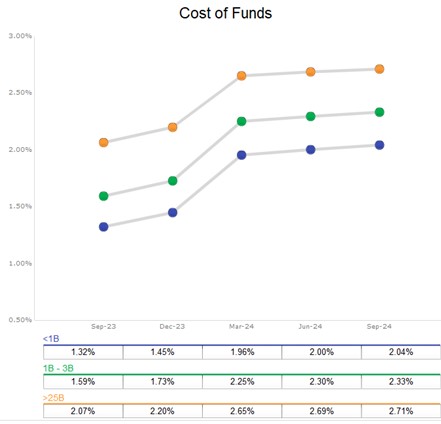
The industry cost of funding over the past five quarters is shown for three asset peer groups: banks under $1B (3.5k banks), $1-$3B (623 banks), and greater than $25B (84 banks). It appears that community banks (represented in the first two asset bands) have seen their cost of funds plateau, with COF increasing in the last reported quarter by only a few basis points.
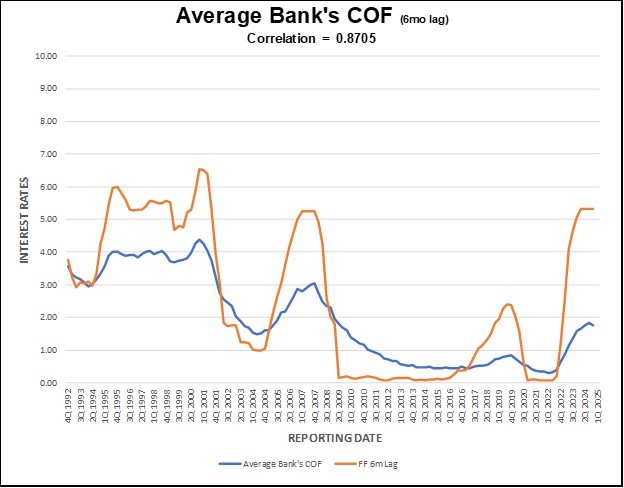
We analyze all FDIC-insured commercial banks and S&L associations, as well as credit unions, over the last three decades and plot COF versus short-term rates (Fed Funds). We find that financial institutions’ COF behavior is similar across various asset sizes. The correlation coefficient between the industry’s COF and short-term rates (Fed Funds) is in the high-80s. The industry’s lag between short-term rates and COF has historically been approximately six months.
Below is a graph showing the average bank’s COF (non-size weighted) versus Fed Funds with a six-month lag. The correlation coefficient is 0.87 using that six-month lag.
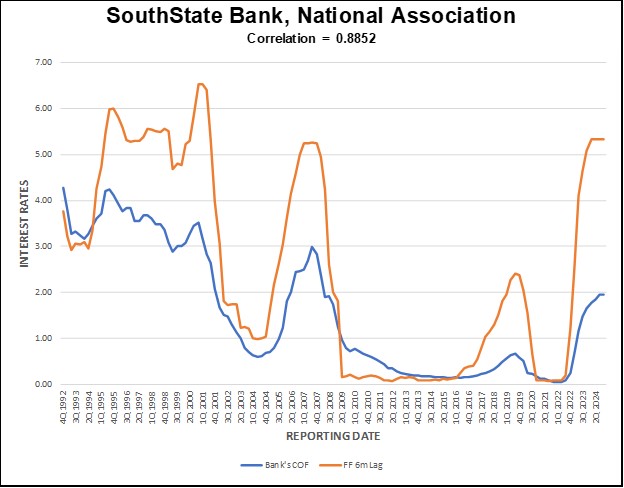
Every bank will exhibit a unique behavior between its cost of funding and short-term interest rates based on its deposit mix, and competitive environment. We can produce the above graph for any institution that is interested (just email), and we can show your bank’s deposit mix, and asset duration compared to peers (contact us for such a report). SouthState Bank’s COF correlation to Fed Funds is almost 0.89 as shown in the graph below.
Forecasting Future Interest Rate Cycles
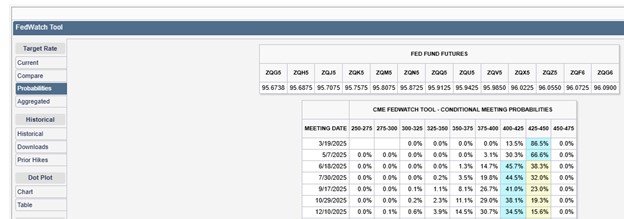
We believe that forecasting interest rates is a risky business. At any point in history, any interest rate view beyond a one-year horizon is just a guess. Even forecasting the next few quarters can be challenging. The market now expects one 25bp rate cut in 2025 as shown in the graph below (from CME Group FedWatch Tool).
However, the distribution around that expectation is skewed to the upside given the expressed, but yet to be enacted, fiscal policies. Historically, bank deposit betas ranged between the low-20s and mid-50s, depending on the length of the hiking cycle, the magnitude of total hikes, the size of each increase, and balance sheet changes at the Fed. We should expect that any future changes to banks’ COF will follow a similar relationship to short term interest rates.
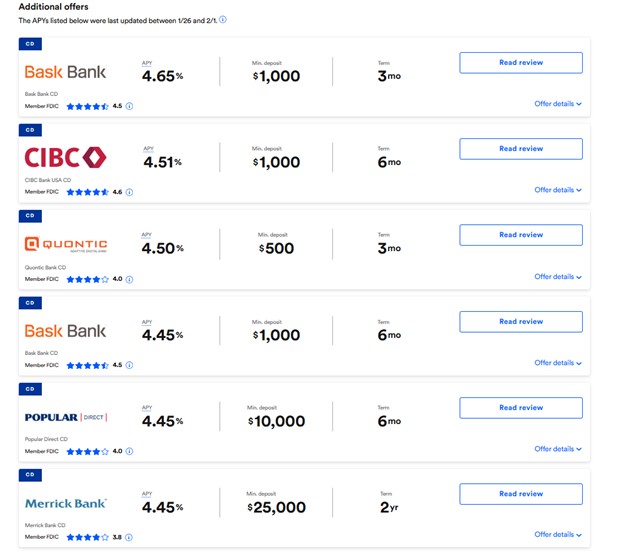
Community banks will continue to see COF pressures from peers, credit unions, national banks, and online banks. Online banks like American Express, Capital One, Ally Bank, and others comprise more than 10% of domestic deposits. These online banks have much higher betas (over 0.70). These institutions increase the industry’s COF faster in a rising rate environment and keep COF higher for longer in a steady rate environment. Below are some examples of the current CD rates offered by some of these banks.
The Federal Reserve is unlikely to further front run fiscal policy. Instead, the Fed will react as fiscal policy’s influence on the economy unfolds. We have written about how the second Trump administration’s policies are skewed towards inflation (here). It is natural that tax cuts, decreased regulation, more government debt, and tariffs may be pro-business and pro-domestic consumption. This will most likely lead to higher inflation, and potentially higher interest rates. Banks should approach their product development, target marketing, and capital allocation based on the probabilistic COF projections, with a skew to the upside (more on this concept here and here). A pause for an extended period, or another rate hiking cycle from these short-term interest rates would find some community banks flat-footed, and subject to increased NIM pressures.
How to Apply to Your Bank
Community bank managers should take a wholistic view of their bank’s balance sheet. For example, trying to change deposit mix, without considering how loans to the right clients can lead to more stable and lower-priced deposits may not lead to optimal results. The same goes for fueling asset growth if you are not already making above your cost of capital. This could place more pressure on a bank’s COF exacerbating poor performance.
In addition to shortening your asset duration to better match deposits (naturally or with a hedge), our hit list of deposit tactics includes:
- Focused marketing on customers right after onboarding (HERE).
- Using several of our top 15 most effective deposit marketing campaigns (HERE).
- Spending more resources targeting our top 25 treasury rich industries (HERE).
Each community bank manager should understand how the bank’s cost of funding is correlated to short-term rates and consider how deposit mix and asset duration compares to peers or high-performing banks. Contact us if you would like to receive a report specific to your institution.