FTP – Another Bank Failure and Another Learning Opportunity
Last week, we published an article [here] discussing how fair value accounting for assets and liabilities may have prevented the failure of Silicon Valley Bank, even if sound risk mitigation practices were not resolutely embraced by management. We argued that valuing assets at historical value or measuring net interest margin (NIM) is not only a static view of cash flow but also backward-looking. Bank executives that measure and manage the balance sheet based on the fair value of assets and liabilities invariable will change risk behavior, compensation structures, and capital allocation for the long-term benefit of shareholders. Fundamentally sound concepts in banking lead to management decisions that optimize risk management, employee compensation, and capital allocation. The other fundamental concept that makes sense for all banks to adopt is fund transfer pricing (FTP). FTP may have prevented the demise of First Republic Bank.
Fund Transfer Pricing
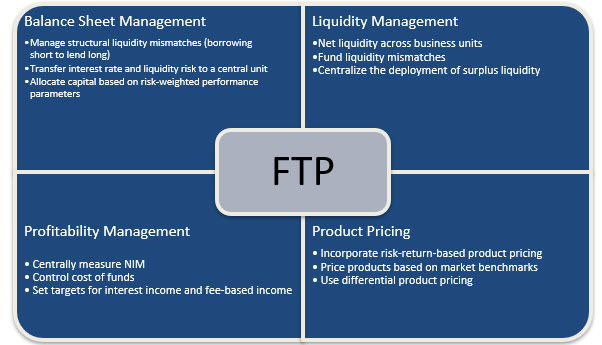
We have written about FTP and how it related to the risk issues we witnessed as the Federal Reserve pivoted to fight inflation and how some banks did not respond sufficiently or quickly. In summary, FTP is both a regulatory requirement and an essential tool for managing a bank’s balance sheet structure and measuring risk-adjusted profitability. FTP measures interest rate, credit, and liquidity risk and enables costs to be transferred from central treasury functions to the bank’s products and business lines. Fundamentally, FTP divides a bank’s overall NIM into two major sub-margins (one for deposits and one for asset origination). Banks can then measure the economic value obtained from each action taken separately. FTP can be extended to provide other analytical tools, as shown in the graph below.

Specific Example
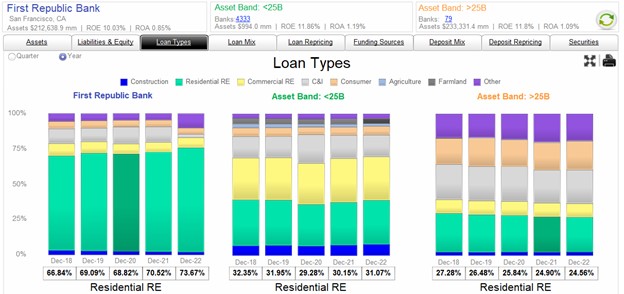
Let us consider First Republic Bank’s (FRB) balance sheet. The graph below compares the loan composition of FRB and all banks in the country under, and over, $25Bn in assets. The data shows that FRB had a much higher composition of residential mortgages (shown green) than any of its large bank peers or any average smaller bank in the country.

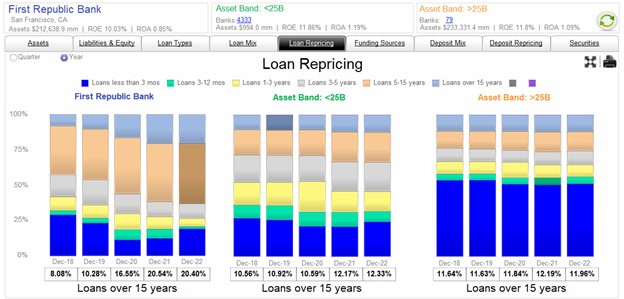
Next, consider the repricing buckets for all loans at FRB compared to other banks in the country. The graph below compares the loan repricing for FRB’s loan portfolio and all banks under, and over, $25B in assets. It is not surprising that most homeowners and commercial borrowers want payment certainty, and FRB’s mortgage portfolio demonstrates long duration, which is not matched by its shorter repricing and withdrawable deposits. The graph below illustrates FRB’s long-term fixed-rate loans as the sum of the top three colored portions of the bar chart (loans repricing in three to 30 years).

As a side note, FRB’s long-term fixed-rate loans had a carrying value of $137B at the end of 2022 but a fair value of $118Bn, or a loss that more than wiped the bank’s $14B in capital. If FRB had focused on fair value accounting, management might have avoided this mismatch in funding and asset duration.
How FTP Changes Decision Making
We were not on the board of FRB, and we did not participate in that bank’s ALM meetings, but we interact with banks that get into the same pickle by not employing FTP. In fact, we had a conversation just last week with the head of a lending division at a large regional bank. He insisted that his portfolio of owner-occupied medical practice loans was profitable when originated (through the beginning and middle of 2022), but because of interest rate movement since loan origination, the bank is now carrying an unprofitable portfolio with diminished NIM. He stated, “This was just the vagaries of the market, and nothing would have been done differently at origination.” This portfolio of loans has an average weighted coupon of 3.94% and offsetting deposit balances 20% of the loan portfolio. Most of the deposits, unfortunately for the bank, are now moving from DDAs to MMDA and CDs, with rising costs to the bank.
When these loans were booked at 3.50% to 4.25% coupons, the bank’s cost of funding was sub 0.35%, and the lending team convinced management that a 3.75% NIM was an attractive earning asset, especially considering the sizeable, stable, and cheap deposit cross-sell opportunities. But had this bank used FTP to price loans, compensate employees and allocate capital, the outcome on this portfolio would have been different. At its basic premise, FTP distributes banking profit between lending and deposits. In the middle of 2022, when the bank’s cost of funding (COF) was 0.35%, the 10-year hedge rate averaged 3.21%, and using FTP, the lending margin was therefore only 0.73% (3.94%, average coupon, minus 3.21% average funding costs based on market-driven 10-year rates). Using FTP and decomposing the lending spread, management would have either passed on the loans or at least hedged the interest rate risk on the loans to avoid another source of margin compression. The lending team may have decided that this loan portfolio was not as attractive as it first appeared, and certainly, a different lender incentive based on lower profitability may have played a role in how much of this business the lending team wanted.
However, FTP would create another source of enlightenment. The difference between the bank’s funding costs of 0.35% (the base rate) and the 10-year hedge rate of 3.21%, or 2.86% is the funding spread. This is the immediate benefit that the bank’s funding department is providing. The funding spread is the work of the bank’s deposit gatherers (primarily branch network) and is a reflection of the bank’s ability to pay below fed funds on deposits. While Fed Funds started 2022 at almost zero, it ended the year above 4.00%, and the bank’s treasurer knew that the market was expecting increasing short-term rates, and pressure on funding costs. The funding spread was going to be reduced well below 2.86% over the near term, and the branch network was certain that I could not deliver a 2.86% funding spread below the yield curve. Using FTP, the funding team would forecast much less than the 2.86% funding spread over the life of the loan. Further, the funding team would also dismiss the value of the deposit cross-sell, arguing that larger commercial non-operating account balances would flee as interest rates increase as customers demand higher returns on excess business funds.
Utilizing FTP would lead bank management to allocate profits differently between lending and funding teams, perhaps try to eliminate margin compression through hedging and maybe avoid this business altogether.
Conclusion
Community banks should consider incorporating a simple FTP model for appropriate product pricing and incentive compensation. Incorporating an FTP framework can change the understanding of the makeup of net interest margin and how a bank’s lending and deposit activities contribute to economic profitability. An FTP framework may save a bank from the pitfalls befallen FRB and other recently failed banks.

