What Drives Bank Acquisitions?

When it comes to bank acquisitions, there are metrics that matter. We analyzed all community banks acquired from 2020 to the end of 2024 (approximately 600 banks), and we measured those defunct banks’ performance compared to surviving banks. The defunct banks were all under $10Bn in assets and our hypothesis was that return on assets (ROA) (or return on equity (ROE)) were the main predictors of survivability. We want to share the results of our analysis in this article.
The Background
We have published numerous analysis and industry data showing that banks that attempt to increase asset yield to expand net interest margin (NIM) do not succeed in increasing ROA/ROE (here and here).
The long-term relationship between NIM and ROA for the industry and for community banks is slightly negative (R2 of -0.02). While many bankers focus on developing strategies to increase loan yield to widen NIM, there is no relationship between loan yield and ROA because loan yield (or NIM achieved through higher asset yield) does not measure profitability drivers such as loan credit quality, loan size, term of the loan, or cross-sell and relationship value. Because most community banks do not use a risk-adjusted return-on-capital (RAROC) loan pricing model, the only variable that is easy to measure is NIM. However, NIM is one of the least important attributes specific to loan performance and the general profitability of the bank. The market is efficient enough that strong borrowers with sizable credits and those willing to provide a total banking relationship to a lender also obtain lower credit spreads.
The Data on What Drives Bank Acquisitions
To figure out what metrics drive bank acquisitions, we went to the data. We measured various financial ratios of defunct (acquired) community banks between 2020 and 2024. We analyzed which of these financial variables best predicted whether a bank would be acquired. There were almost 600 community banks in our defunct population over this period. The graph below shows the difference between ROA and ROE between surviving and defunct banks.
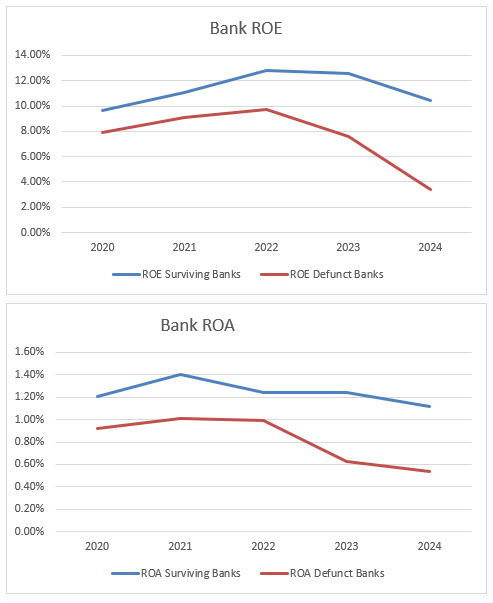
Defunct banks had substantially and statistically significant lower ROA and ROE than surviving banks. For the statistically inclined, the one-tail ROA Z score was -3.69, and P value of 0.0001 – the upshot is that both ROA and ROE for defunct banks was substantially lower than surviving banks. This was the number one factor/predictor of survivability.
The hypothesis is that defunct banks may also show a lower NIM. But not surprising, that is not the case. The NIM for surviving and defunct banks is shown in the graph below.
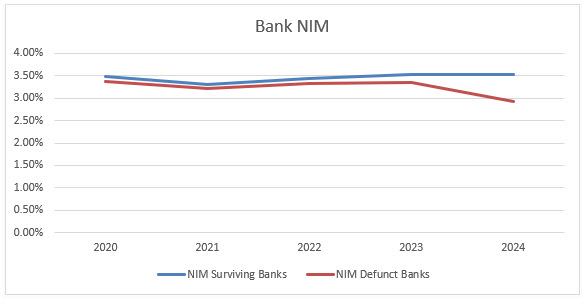
The NIM between the two groups is almost identical with a one-tail Z score of -.021, and P value of 0.42 – no statistical relationship. The largest divergence of NIM for defunct banks was in 2024, and we believe this reflected increased asset duration at defunct banks, which resulted in decreased profitability through margin compression with rising interest rates. We believe that this divergence in 2024 reflects how banks that simply measure NIM got into trouble by not considering the shape of the yield curve and took on interest rate risk without concern for ROA/ROE. The conclusion we reached is that NIM was not a predictor of bank survivability, but ROA and ROE were strongly correlated to banks surviving.
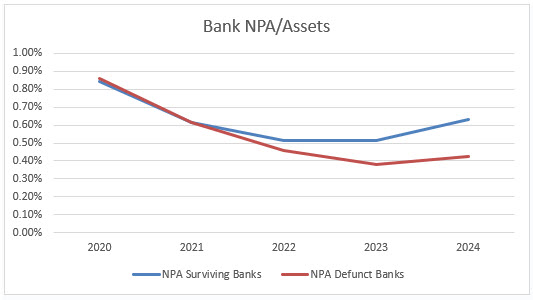
We also looked at other factors such as asset size, asset growth, and asset quality (NPA to total assets is shown in the graph below). However, no other variable was a predictor of bank survivability during this period except for ROA/ROE. In fact, NPA to total assets was lower at defunct banks than surviving banks, although not statistically significant, and both were at low historical levels.
Conclusion
When it comes to bank acquisitions, the best way to acquire, and the best way not to be acquired is to produce an above average ROA/ROE.
While many bank managers focus their lenders on increasing loan yield, the result is typically not higher ROA/ROE. Because some community banks, and virtually all regional and national banks use some version of RAROC loan pricing (and those banks in totality compose almost 90% of the market), the market becomes efficient enough that strong borrowers with sizable credits and those willing to provide a total banking relationship to a lender also obtain lower-priced loans and those banks with a RAROC model are willing to lend to such borrowers.
We believe that community bank managers must utilize RAROC pricing for loans and deposits, and measure lifetime value. If your bank is not using a RAROC model, then the following criteria are important to consider for any pricing decision:
- Profitable customers lead to higher bank ROE.
- Credit quality is crucial at this stage of the business cycle.
- Banks need to seek the highest and longest set of cash flows.
- Acquisition and maintenance costs reflect on bank performance.
- Larger and longer loans are more desirable.
- Expanding relationships opportunities are more profitable than steady or declining opportunities.
- Fee income is critical to bank performance. Our long-term analysis shows that fee income has over 0.90 R2 relationship to ROA/ROA.
NIM does not predict community bank survivability. But ROA and ROE do.
Community banks that do not use RAROC should focus attention on sizeable, high credit quality, long-term relationship that can generate fee income.