Reading the Forward Curve in 2026

For much of the past year, some loud and persistent voice(s) had insisted that interest rates are headed lower, and a surprising number of market participants have arranged their balance sheets as though that outcome were a certainty. The evidence does not point that way. Inflation remains stubbornly above target, the Federal Reserve has held its policy rate steady through the first half of 2026, and – most tellingly – the market’s forward curve is not pricing the rate cuts that the “lower rates” chorus keeps promising. This article examines three things every community banker should weigh before committing the balance sheet to a single rate scenario: how much predictive power the forward curve actually has, where inflation stands today, and what the current SOFR forward curve is really saying. We also summarize action plans covering loan structuring, deposits, and ALCO governance.
The Forward Curve Is Not a Crystal Ball
There is an old saying on trading floors: a forecaster who is almost always right and one who is almost always wrong adds the same value, because you can act on either. The trouble with the forward curve is that it is neither. It is not reliably right and not reliably wrong – it is one predictor of where rates go, and it tends to be imprecise when accuracy matters most, at inflection points.
The chart below makes the case across four decades. The solid blue line is the actual path of short-term rates since 1985 (Prime, LIBOR, and Fed Funds are 99% correlated over this period). Each faint dashed line is a forward curve as it was priced on a particular date – the market’s best collective view at that moment. Notice how rarely those dashed lines track the blue reality (where rates set). The most expensive miss is highlighted: in late 2021 the forward market priced short rates to crawl near zero for the better part of a decade. Instead, rates erupted above 5% within two years. Banks that extended asset duration on the strength of that “lower for longer” curve learned the hard cost of interest rate complacency.
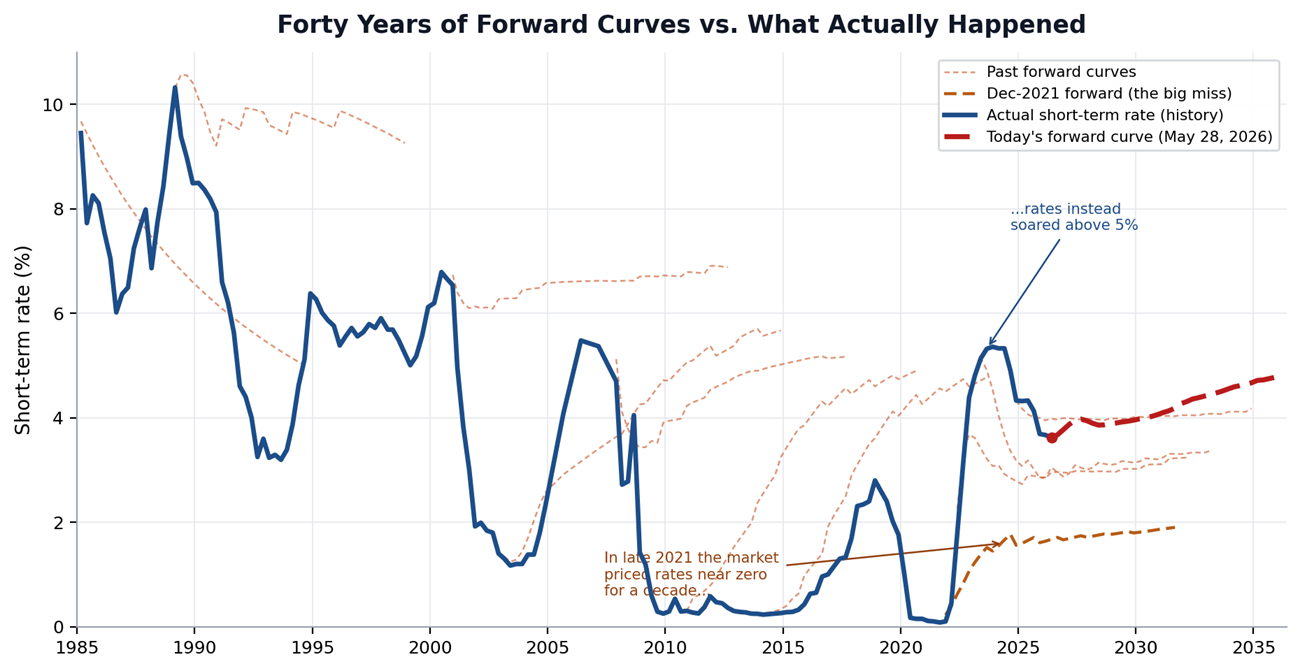
The forward curve is best understood as the market’s break-even, not its prediction. It identifies the rate path at which a fixed-rate and a floating-rate asset would earn the same return – this makes it indispensable for pricing, but dangerous as a crystal ball. If the market and professional economists struggle to forecast rates, it is unrealistic to assume an ALCO can systematically outwit them. The disciplined posture is to understand what the market expects, decline to bet the balance sheet against it, and keep duration manageable so that being wrong is survivable.
Where Inflation Actually Stands
The entire case for “lower rates soon” rests on inflation falling back to target. It has not. The Federal Reserve’s preferred gauge, core PCE, registered 3.3% year over year in the reading released at the end of May, with headline PCE running at 3.8%. Core inflation has sat above the FOMC’s 2.0% objective continuously since 2020, and a renewed oil shock together with tariff pass-through pushed it higher this spring rather than lower. The Dallas Fed’s trimmed-mean PCE, near 2.3%, is the only mainstream measure anywhere close to target — the balance of evidence is stacked decisively to the high side.
The Federal Reserve has responded by deliberately doing nothing. It has held the federal funds target range at 3.50%–3.75% for three consecutive meetings, and the April decision drew four dissents – the most since 1992. The minutes reveal a committee leaning hawkish: many participants wanted to strip the easing bias out of the statement, and several signaled that further policy firming would be appropriate if inflation kept running persistently above 2%. Market-implied pricing now anticipates little change in 2026, with a meaningful camp expecting the next move to be a hike rather than a cut. A borrower or banker positioned for imminent, substantial easing is fighting both the data and the committee.
What Today’s SOFR Forward Curve is Really Saying
Here is where the “rates are falling” narrative collides with the market’s own money. The current SOFR forward curve, struck on May 28, 2026, begins at 3.62% – consistent with the prevailing policy rate – and then drifts higher, not lower. It climbs toward 3.95%–3.97% by late 2027 and resumes its ascent to 4.06% by 2030 and 4.78% by 2035.
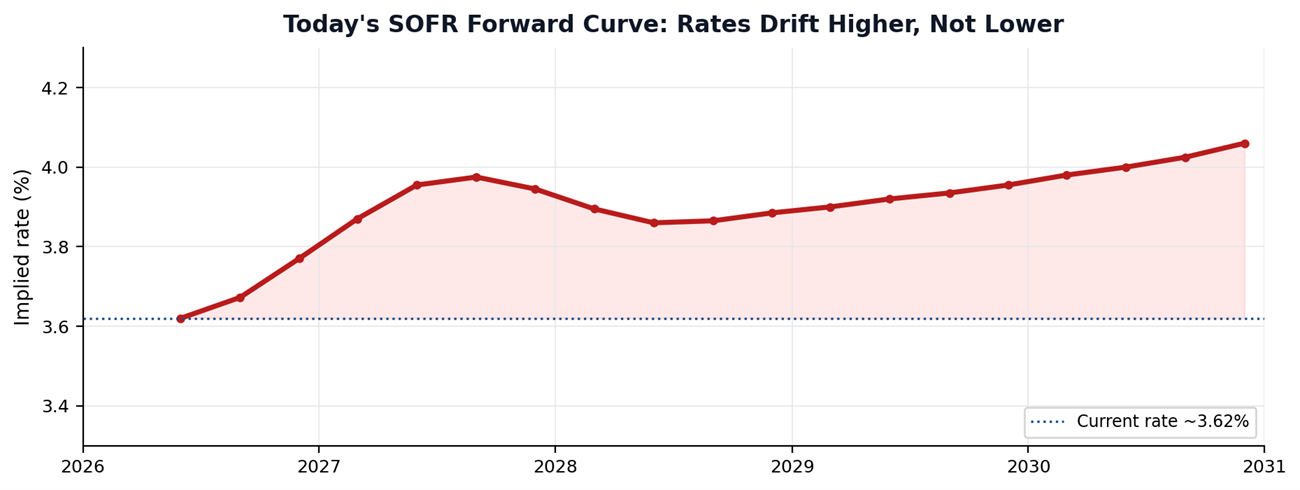
In plain terms, the market is not pricing the rate cuts that the loudest voices keep forecasting. It is pricing rates that hover near today’s level and grind upward over the medium term. This matters for two reasons. First, it confirms that “the market expects cuts” is, at present, simply untrue. Second, and consistent with the first section, even this upward-sloping curve should be treated as a break-even, not a promise. If inflation proves stickier than the curve assumes, realized rates could exceed it; if a recession arrives, they could fall well below it. The honest conclusion is that the distribution of outcomes is wide and, today, tilted toward “higher for longer.”
Summary and Action Plan
The threads converge on a single message – the forward curve is a poor predictor and now, is not even predicting cuts; inflation remains above target and the Fed is on hold with a hawkish tilt; and fixed-rate lending into elevated inflation quietly destroys real value. Community banks need not outguess the market – the lesson is that essentially no one can. They simply need to stop betting on a single dovish scenario. The practical steps fall into three areas.
Loan structuring. Favor floating-rate and shorter fixed-rate structures, and where clients genuinely want longer fixed terms, deliver them but hedge your interest rate risk. Use repricing dates, hedges, and prepayment protection, and call features to keep effective duration in check. Serve the customer’s need and solve the resulting ALM exposure separately through loan hedging.
Deposit structure and deposits. Funding is the other half of the equation. Deepen core operating relationships that are inherently less rate-sensitive, lengthen and diversify wholesale funding where it is economical, and avoid funding longer fixed-rate assets with short money that can reprice or flee. Model deposit betas honestly: a balance sheet that looks asset-sensitive on paper can behave as liability-sensitive in practice if deposits reprice faster and migrate further than assumed. Build and reward sticky, transaction-based deposits now, while you can, rather than competing on rate after funding pressure arrives.
ALCO planning. Treat the forward curve as one scenario but run genuinely alternative paths – a “higher for longer” track and a renewed inflation surge alongside the consensus and a recession case – and dynamically reassess ALM assumptions instead of freezing them. Stress both net interest income and the economic value of equity, document the duration and real yield of new fixed-rate production, and set concentration limits on long-dated fixed-rate assets. As an old banking mentor liked to put it: if you do not hold a firm view contrary to the market, keep your assets and liabilities short, and you will not go far wrong.